Quarterly Turnover Statistics Report
Debtors >Reports >Report list
Quarterly turnover statistics report grouped by either Region, Division or Sales Rep
Due to the width of the data being reported this report is best viewed on screen by dragging the size of the report screen
outwards to enlarge the report or to use the Copy to Clipboard function and view the data in a spread sheet.
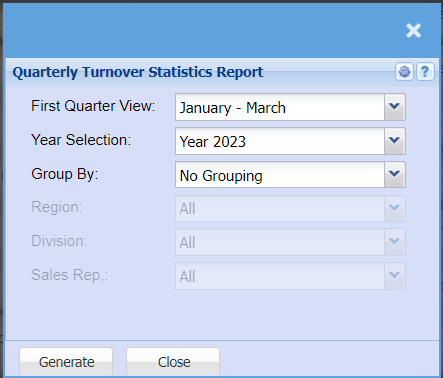
| First Quarter View | Allows the user to select where the first quarter of the report should start. The dropdown allows the user to select the starting quarter to start at any month of the year with the subsequent quarters being calculate in the background. e.g., Quarter 1: March – May, subsequent quarters, Quarter 2: June - August, Quarter 3: September - November, Quarter 4: December – February (Next Year) |
| Year Selection | Allows the user to select what would be the primary year and the report calculates one year back for the comparative year. |
| Group By | Allows the user to view the report in different formats. No Grouping: Displays the report in debtor alphabetical order. |
| Region | Displays the all the data grouped by regions in debtor alphabetical order. Region dropdown Specific Region: Displays only that Region’s data in debtor alphabetical order. |
| Division | Displays the all the data grouped by Divisions in debtor alphabetical order. Division dropdown Specific Division: Displays only that Division’s data in debtor alphabetical order. Please Note: Due to the data being dependent on Invoices and Credit Notes being linked to Sales Reps. The resulting report may not be accurate if not all Invoices and Credit Notes are not linked to Sales Reps. |
| Sales Rep | Displays the all the data grouped by Sales Reps in debtor alphabetical order. Sales Rep dropdown Specific Sales Rep: Displays only that Sales Rep’s data in debtor alphabetical order. |
No Comments