Creditors Graph
Creditors >Reports > Report List
Shows a line or bar graph of all GRVs less Stock Returns for a specific Creditor. Daily intervals can be specified.
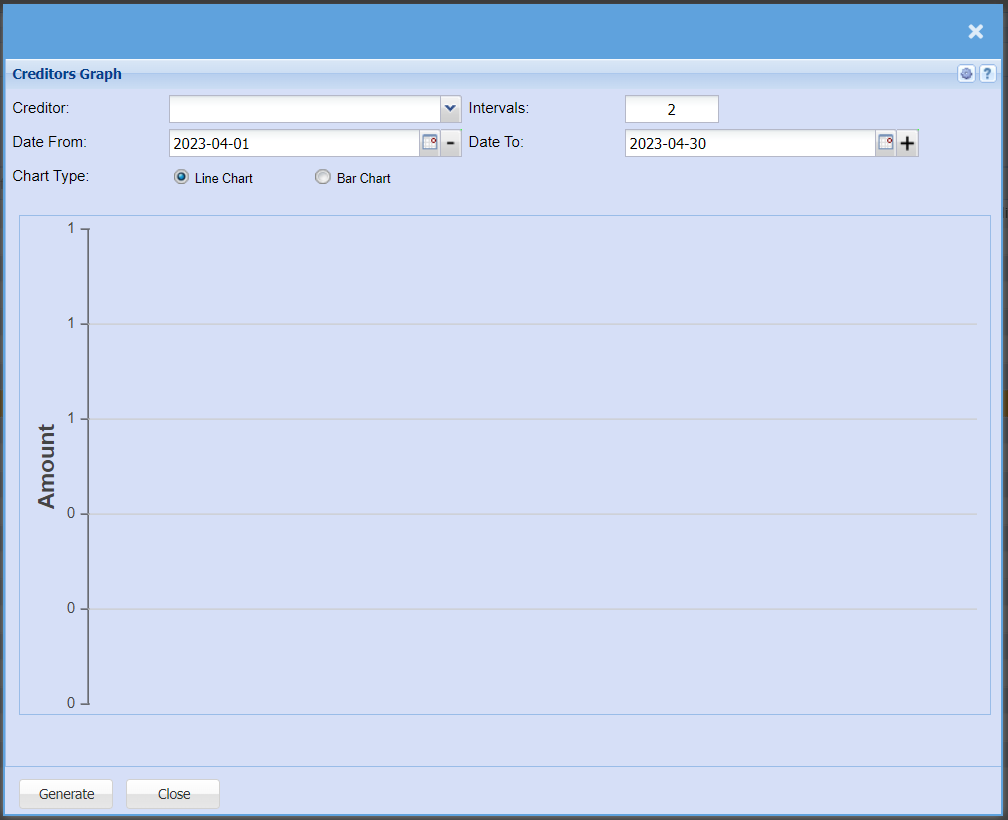
| Creditor | Select a creditor/supplier from the drop-down menu that you would like to pull a report for. |
| Intervals | Intervals refers to the days between each figure |
| Date From / Date To | Choose the date range for which you want to view the report from / Select a date range of when you want to see up to on the report. |
| Chart Type | Select if you would like your graph in a line graph or bar graph |
| Generate button | Click the "Generate" button to open the report. You will have options to copy, email, or print the report. To view the report in an Excel document, copy the report and paste it into an Excel file. |
No Comments