
Average Costing when returning stock RTS
Question
How does average costing work in accounting with stock? if we have 17 units on hand at $0.3151, then we receive more stock, additional 250 units at cost of $1.73. What is the average price at this point. Then we return the 250 units at cost of $1.73. Thereby leaving us with 17 units on hand. What is the average cost at this point and how did you get to this number
Here’s a clear, step‑by‑step explanation of how average costing works using your exact numbers.
Returning stock back with same cost price
✅ 1. Starting Position
You have:
- 17 units
- Unit cost = $0.3151
So your starting inventory value is:

✅ 2. Receive 250 units at $1.73 each
This is where weighted average costing applies.
Step 1 — Add the new stock
- 250 units @ $1.73
-
Value =

Step 2 — Combine with existing stock
Total units after receipt:
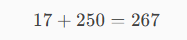
Total value after receipt:

✅ New weighted average cost:

Rounded appropriately:
➡️ New average cost ≈ $1.6406 per unit
✅ 3. Now you return the same 250 units at $1.73
Important point:
In weighted average costing, returns reverse the original receipt at the item's original receipt cost, NOT at the average cost.
So the system removes:
- 250 units
- Cost per unit for the return = $1.73
Step 1 — Deduct the units

Step 2 — Deduct the value removed

Step 3 — Recalculate remaining inventory value

✅ New weighted average cost after the return
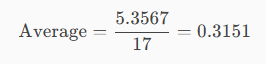
✅ Final Answer:
You end up with:
- 17 units
- Average cost = $0.3151
Which is exactly the same as the original cost.
✅ Why does the average cost return to the original value?
Because:
- The 250‑unit receipt increased the average.
- The 250‑unit return reversed that exact receipt.
- Under weighted average costing, returns must undo the receipt at the original receipt cost, not the new average.
This leaves inventory unchanged, so your cost per unit returns to the original $0.3151.
Returning stock at a different cost price
What happens when the average price returned is different to the original purchased price
Great question — this introduces an important nuance: under average costing, the value of a return depends on the cost the system uses for returns.
Different ERPs behave differently, but the two common methods are:
- Return at the original receipt cost (e.g., $1.73)
- Return at a user‑entered cost (your scenario: $1.50)
I'll show you exactly what happens mathematically when the return is at $1.50.
✅ Starting Point (after the purchase)
From the earlier calculation:
- Inventory before return:
- Units: 267
- Total value: $437.8567
- Average cost: $1.64061
Now we return 250 units @ $1.50.
✅ 1. Remove the returned units
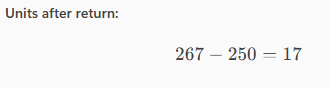
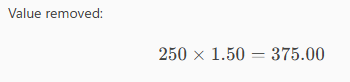
✅ 2. Remove the value of the return
✅ 3. New inventory value

✅ 4. New average cost
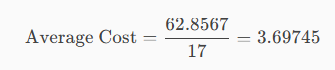
✅ New average cost ≈ $3.6975 per unit
✅ Interpretation
Because the return value ($1.50 per unit) was lower than the receipt cost ($1.73), inventory value was reduced less than it originally increased.
The result is that the remaining 17 units are now valued much higher than before the purchase.
This is abnormal in typical average‑cost inventory systems (which normally force returns at the original receipt cost to keep the costing accurate), but some systems allow user‑entered return costs.
✅ Why does the average jump so much?
Breakdown:
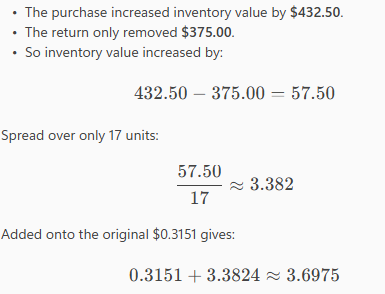
- The purchase increased inventory value by $432.50.
- The return only removed $375.00.
- So inventory value increased by:
Spread over only 17 units:
Added onto the original $0.3151 gives:
✅ Summary of outcomes
|
Event
|
Units
|
Total Value
|
Average Cost
|
|---|---|---|---|
|
Starting
|
17
|
5.3567
|
0.3151
|
|
After purchase
|
267
|
437.8567
|
1.6406
|
|
After return @ $1.50
|
17
|
62.8567
|
3.6975
|
Examples of processing stock with RTS
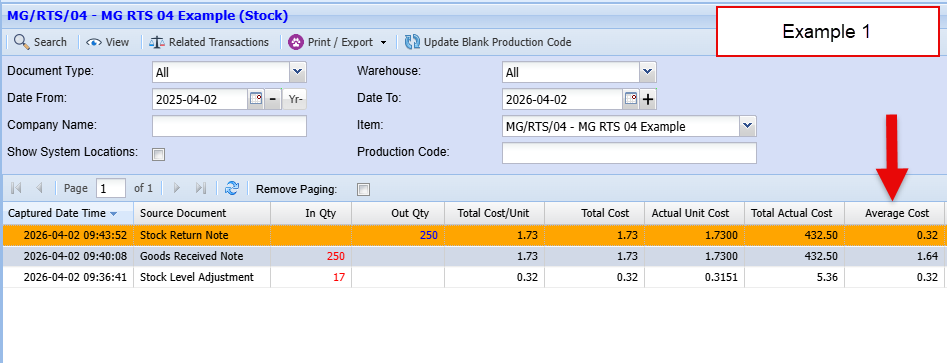
Example 1
GRV stock quantity and cost, then returning RTS stock quantity and cost the same
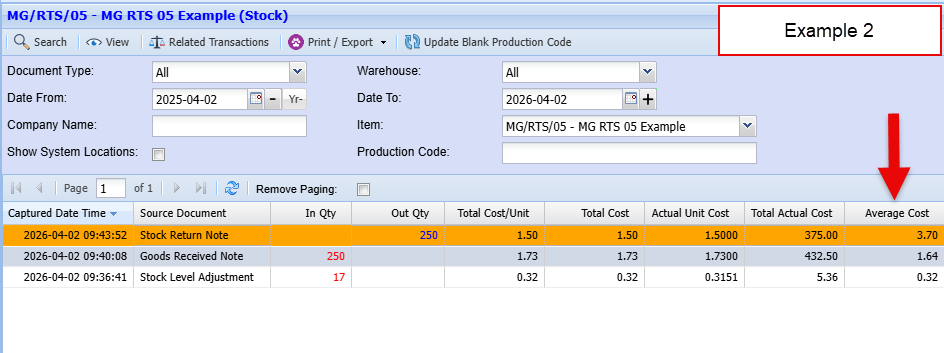
Example 2
GRV stock quantity and cost, then returning RTS stock quantity same but different cost price
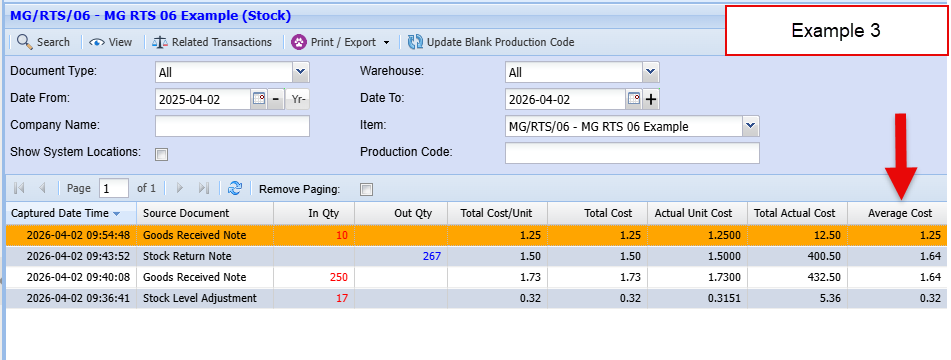
Example 3
GRV stock quantity and cost, then returning RTS stock quantity (All stock on hand) and different cost price
No Comments