Creditors Graph
Creditors >Reports > Report List
Shows a line or bar graph of all GRVs less Stock Returns for a specific Creditor. Daily intervals can be specified.
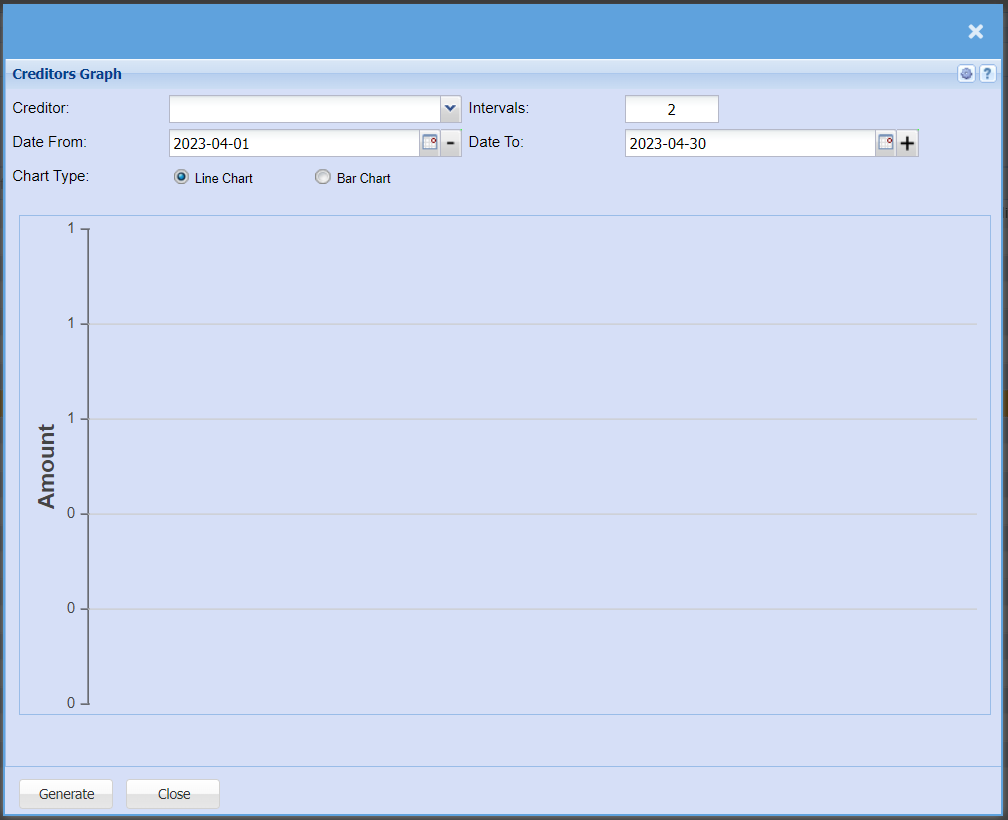
| Creditor | to select a creditor |
| Intervals | to enter the number of intervals |
| Date From | to select date. It allows the user to back date |
| Date To | to enter the date which will stop the report |
| Chart Type | to select chart type by clicking on the dot |
| Generate button | to run the report |