Inventory Combined Forecast Report
Inventory module> Reports> Reports List
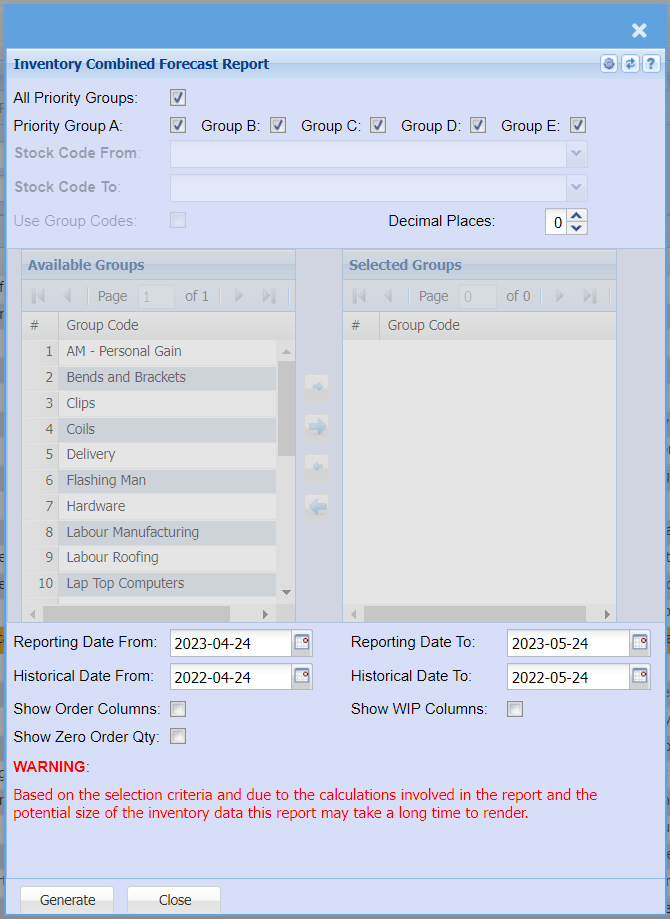
Calculates and forecasts inventory quantities based on the selection criteria and date range.
Please Note: This report will typically take a long time to render due to the
calculations and the size of the inventory data.
| All Priority Groups |
By default, when the report criteria window opens all the Priority Groups are selected, by clicking on the Select Priority Groups tick box they can be unselected and selected. When unselected individual Groups can be selected or unselected. |
| Stock code From |
If you leave the stock item fields blank, all stock items If you choose specific stock items, the report will sort information by |
| Stock Code To |
Select |
| Use Group Code | Use |
| Reporting |
Reporting Date from is the date range to calculate the recent sales quantities of stock items e.g. the last three months. |
| Historical Date From | Historical Date from is the date range to calculate historical sales that will be used to compare and calculate the forecast stock quantities. |
| Show Order Columns | Put a tick on to show order columns |
| Show Zero Order Columns | Put a tick on to show zero order columns |
| Decimanl Places |
It is advisable to set decimals to two places You can view the report with any number of decimal places |
| Reporting Date To | Reporting Date To is the date range to calculate the recent sales quantities of stock items e.g. the last three months. |
| Historical Date To | Historical Date To is the date range to calculate historical sales that will be used to compare and calculate the forecast stock quantities. |
| Show WIP Columns | Put a tick on to show WIP columns |
| Generate Button |
Click the "Generate" button to open the report You will have options to copy, email, or print the report To view the report in an Excel document, copy the report and paste it into an Excel file |
Historical Date from and Historical Date To is the date range to calculate
historical sales that will be used to compare and calculate the forecast stock
quantities.
Show Order Columns when ticked will show the columns that make up the
On Order quantities e.g. Purchase Orders, GRV etc.
Show WIP Columns when ticked will show the columns that male up the
In WIP quantities e.g. Sales Orders, Invoices etc.
Show Zero Order Qty when ticked will show all records that the report
criteria retrieved and processed, when not ticked the report will be filtered
to only show stock items with an order quantity greater that zero.