Analysis of Monthly Sales Figures
Inventory module> Reports> Reports List
Analysis of Monthly Sales figures - Showing Costs and Profit
Inventory module> Reports> Reports List
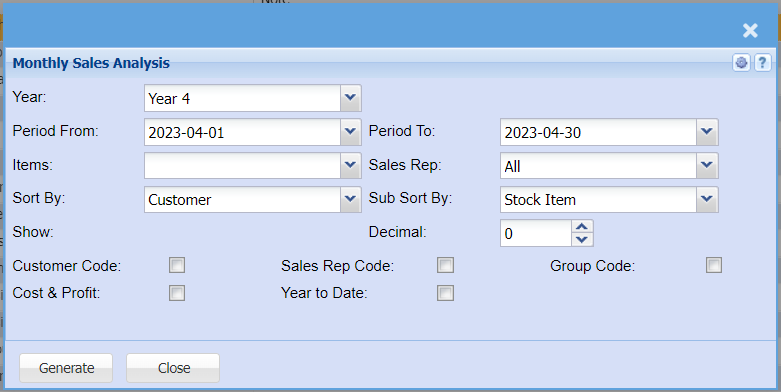
| Year | Select the current financial year you running the report for |
| Period From / Period To | Select the period From and the period to from the drop down arrow |
| Items | Select an item you wish to run the report for or leave it blank to run by all items |
| Sales Rep |
If you leave the sales rep on all the report will run by all sales rep If you want to run a report by a specific sales rep, then you will need to select the sales rep on the drop down menu selection |
| Sort By |
Sort the report by selecting one option from the drop down arrow |
| Sub Sort By |
Select the sort option from the drop down arrow |
| Decimal |
It is advisable to set decimals to two places You can view the report with any number of decimal places. |
| Customer Code | Put the tick on for the report to display customer codes |
| Cost & Profit | Put the tick on for the report to display cost and profit |
| Sales Rep Code | Put the tick on for the report to display |
| Year to Date | Put the tick on for the report to display year to date |
| Group Code | Put the tick on for the report to display group codes |
| Generate Button |
Click the "Generate" button to open the report You will have options to copy, email, or print the report To view the report in an Excel document, copy the report and paste it into an Excel file |