Sales Analysis Report
Debtors >Reports >Report list
This report is broken down per Debtor per item sold with profits made on each item and percentage.
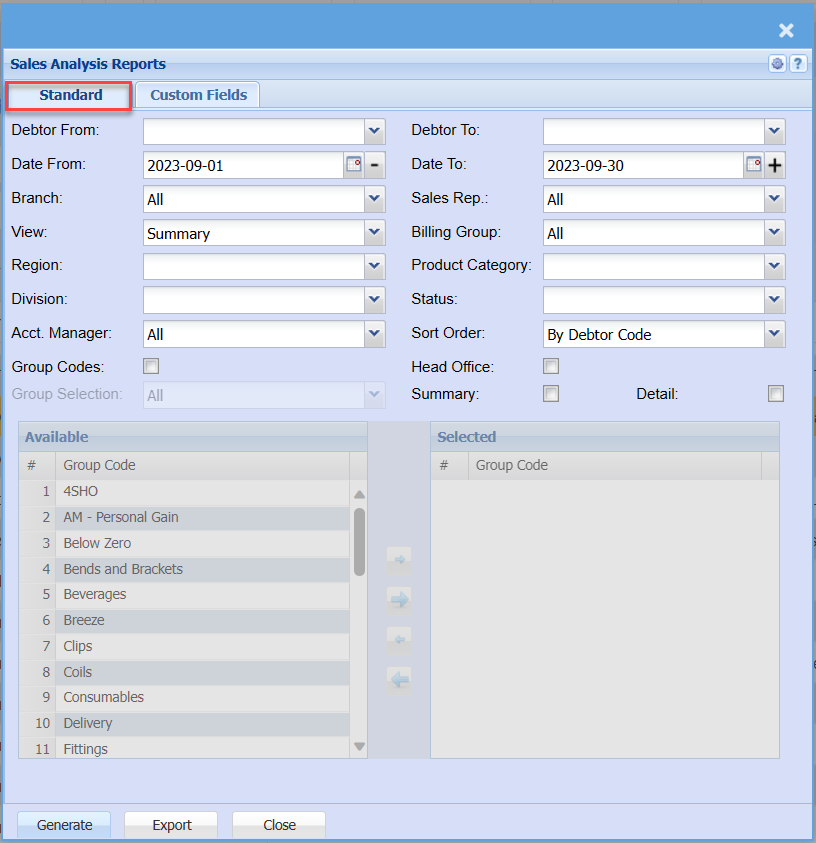
Standard Tab
| Debtor From | to select the debtor from which the report will start running from |
| Date From | to select the date from which the report will run from |
| Branch | to select the branch from the drop down arrow |
| View | to select the way the report can be viewed |
| Region | to select the region from the drop down arrow |
| Division | to select the division from the drop down arrow |
| Acct. Manager | to select the account manager |
| Group Codes | by ticking the box, group codes will be included in the report |
| Group Selection | |
| Debtor To | to select the debtor to – to limit the debtors report run |
| Date To | to select the date to, it could be the current date just to limit the report run |
| Sales Rep | |
| Billing Group | |
| Product Category | to select the |
| Status | to select |
| Sort Order | |
| Head Office | by ticking the office sales analysis |
| Summary | the box allows the user to tick in order to include summary |
| Detail |
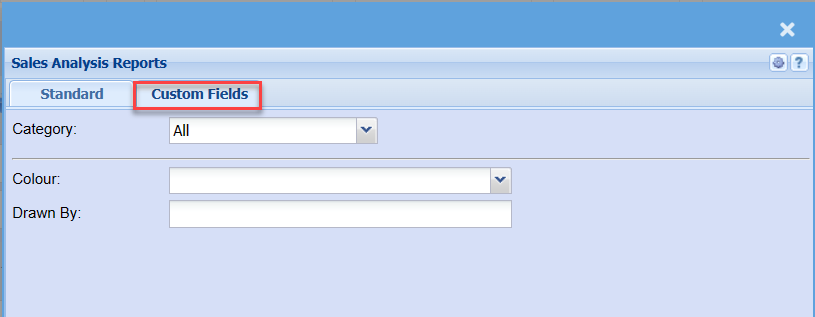
Custom Fields
| Category | |
| Colour | |
| Drawn By |