
Sales Leads Search
The Sales Leads screen allows users to create new Sales Leads or search for existing ones.
Video training manual 2016 - Click Here
Webatar > Activity> Sales Leads
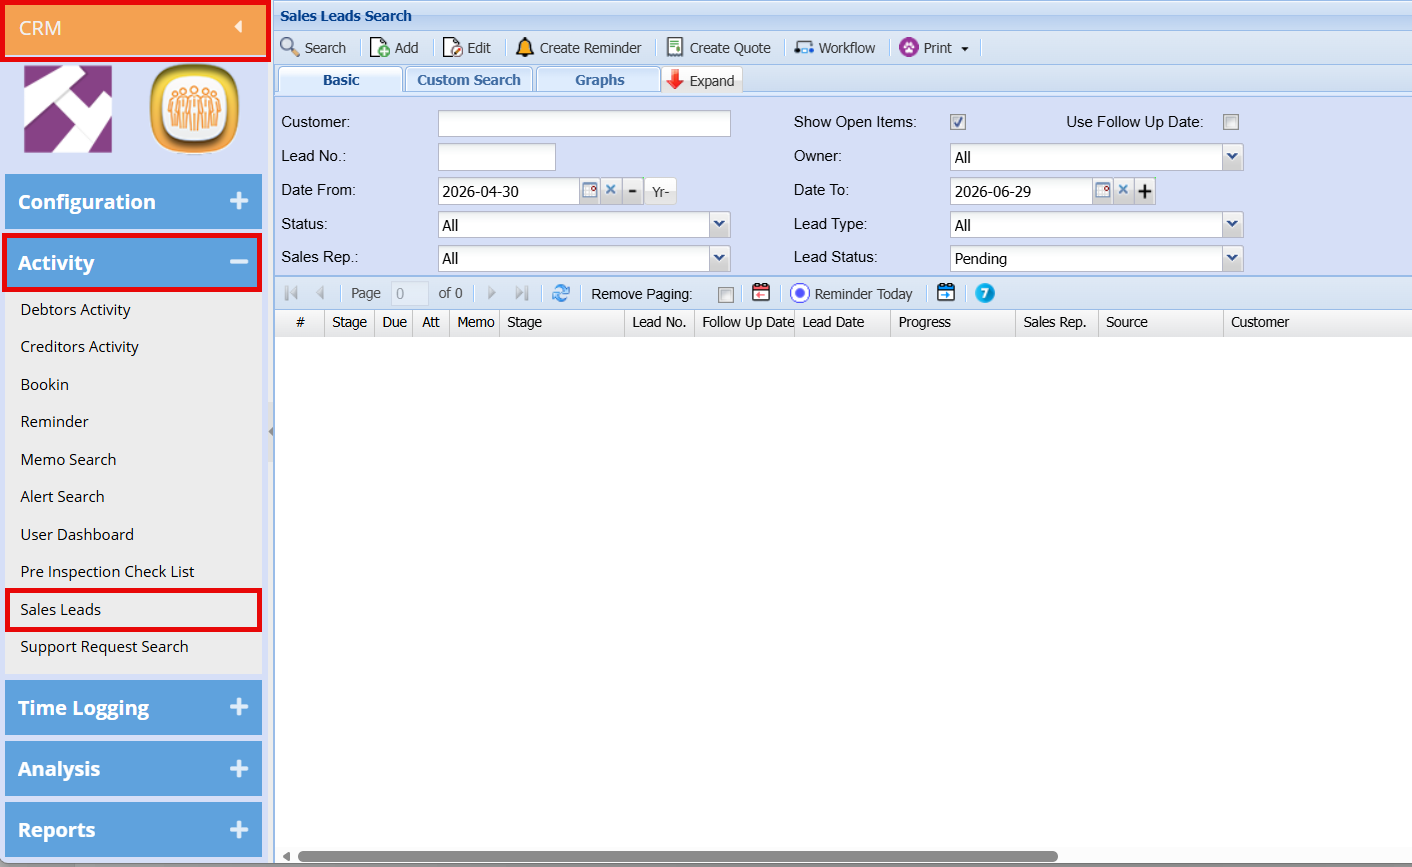
Search Functionality
The search panel enables users to filter and locate Sales Leads using criteria such as Customer, Lead Number, Date Range, Status, Sales Representative, Owner, and Lead Type.
- Select the desired filters and click Search to refine results.
- If no filters are applied, all Sales Leads will be displayed in the grid.
Use the Expand button to show additional search filters, or Contract to hide them.
Action Buttons
Located on the top navigation ribbon:
- Search: Runs the search based on selected filters.
- Add: Creates a new Sales Lead.
- Edit: Opens the selected Sales Lead for editing.
- Create Reminder: Sets a reminder linked to a Sales Lead.
- Create Quote: Generates a quote from the selected Sales Lead.
- Workflow: Access workflow-related actions.
- Print: Opens print and export options.
Print / Export Options
The Print dropdown provides the following:
- Export: Export Sales Leads to an Excel file.
- Print Grid: Print all Sales Leads currently displayed in the grid.
- Print Lead Details: Print details of the selected Sales Lead.
- Print Lead Form: Print a blank Sales Lead form template.
Results Grid
The lower section of the screen displays the results grid, showing all matching Sales Leads with key details such as:
- Stage
- Due Date
- Lead Number
- Follow-Up Date
- Lead Date
- Progress
- Sales Representative
- Source
- Customer
Graph tab
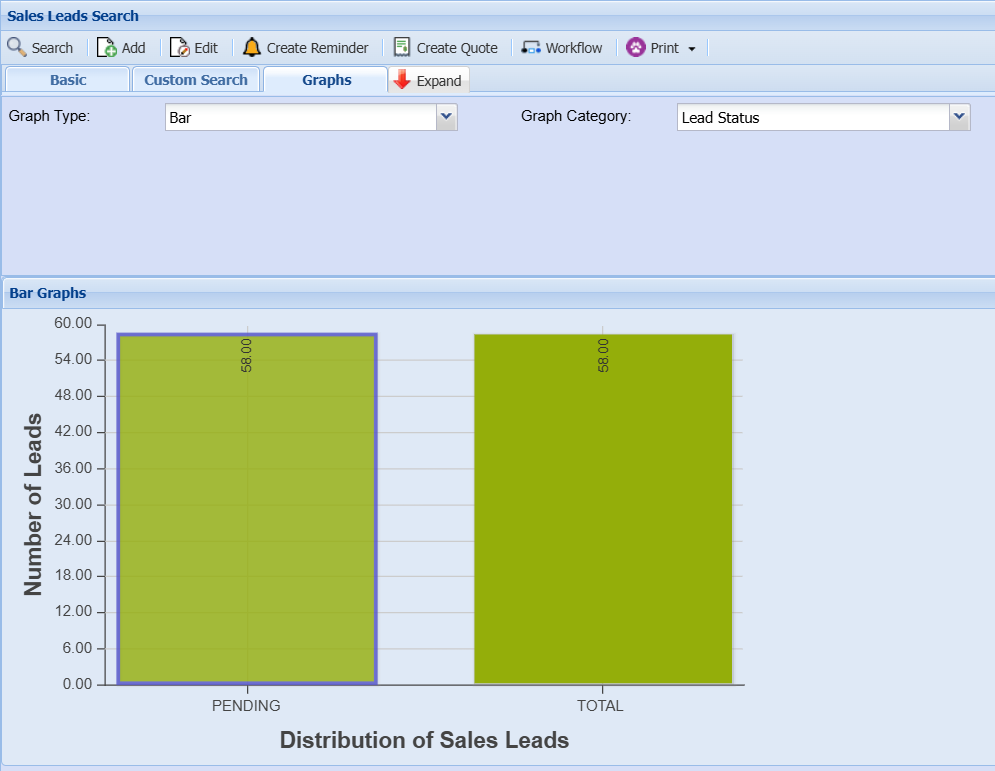
Graph Filters
The following fields are available to customise the graph display:
-
Graph Type
Select the type of chart to display from the dropdown options (e.g. Bar, Line, Pie). This determines how the data is visually presented. -
Graph Category
Select the data grouping for the graph. For example, choosing Lead Status will display leads grouped by their current status (e.g. Pending, Closed). -
Date From / Date To
Define the date range for the data to be included in the graph. Only Sales Leads within this period will be displayed.
Graph Display
The graph is shown below the filter section and updates based on the selected criteria.
- In the example shown, a Bar Graph is used to display the distribution of Sales Leads by Lead Status.
- The vertical axis represents the Number of Leads, while the horizontal axis shows the selected category (e.g. Pending, Total).
- Each bar visually represents the volume of leads for that category, making it easy to compare performance at a glance.
Usage Notes
- Change any filter and refresh to update the graph dynamically.
- Use different combinations of Graph Type and Graph Category to gain deeper insights into Sales Lead activity and trends.
- This feature is useful for monitoring pipeline health, identifying bottlenecks, and supporting reporting.