# Financial Reports

# Book Value Per Share Report

This report displays the Book Value per share worked out by total owners' equity divided by number of shares issued

[![image.png](https://hugeerp10.co.za/hsofmanual/uploads/images/gallery/2026-04/scaled-1680-/Jr5image.png)](https://hugeerp10.co.za/hsofmanual/uploads/images/gallery/2026-04/Jr5image.png)
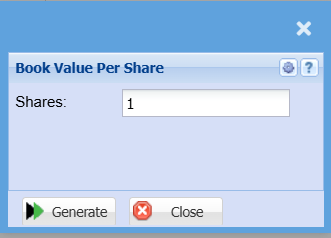
<table border="1" id="bkmrk-shares-%C2%A0-generate-to" style="border-collapse: collapse; width: 100%;"><colgroup><col style="width: 12.6544%;"></col><col style="width: 87.4692%;"></col></colgroup><tbody><tr><td>**Shares**</td><td> </td></tr><tr><td>**Generate**</td><td>to run the report</td></tr></tbody></table>

# Current Ratio Report

Works out the current ratio by taking the total current assets divided by the total current liabilities

[![image.png](https://hugeerp10.co.za/hsofmanual/uploads/images/gallery/2026-04/scaled-1680-/EVyimage.png)](https://hugeerp10.co.za/hsofmanual/uploads/images/gallery/2026-04/EVyimage.png)
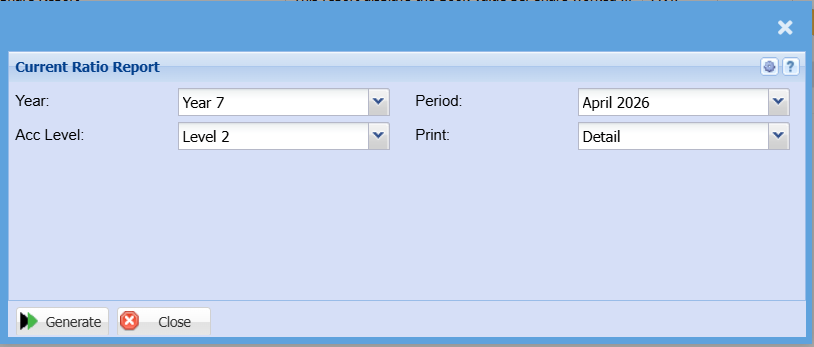
<table border="1" id="bkmrk-year-%C2%A0-acc-level-per" style="border-collapse: collapse; width: 100%;"><colgroup><col style="width: 12.6544%;"></col><col style="width: 87.4692%;"></col></colgroup><tbody><tr><td>**Year**</td><td> </td></tr><tr><td>**Acc Level**</td><td>  
</td></tr><tr><td>**Period**</td><td>  
</td></tr><tr><td>**Print**</td><td>to print the report</td></tr></tbody></table>

# Earnings Per Share Basic Report

Earnings per share gives a share value per financial period month and is worked out nett profit divided by number of shares issued

[![image.png](https://hugeerp10.co.za/hsofmanual/uploads/images/gallery/2026-04/scaled-1680-/zp8image.png)](https://hugeerp10.co.za/hsofmanual/uploads/images/gallery/2026-04/zp8image.png)
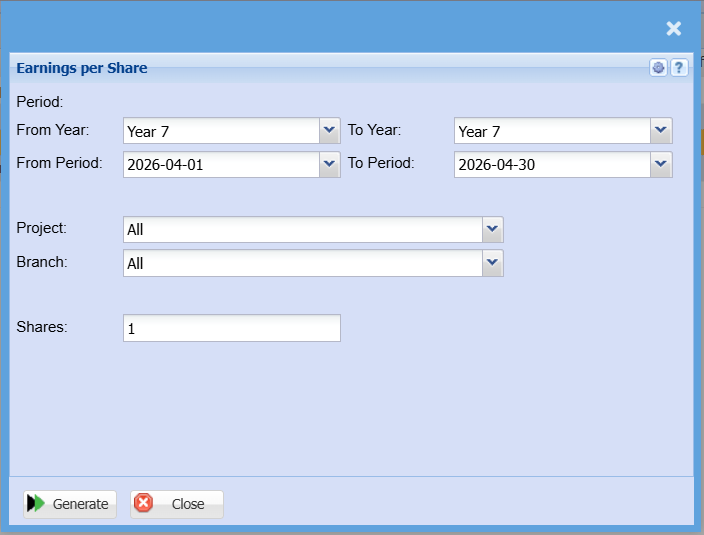
<table border="1" id="bkmrk-from-year-%C2%A0-from-per" style="border-collapse: collapse; width: 100%;"><colgroup><col style="width: 14.8766%;"></col><col style="width: 85.247%;"></col></colgroup><tbody><tr><td>**From Year**</td><td>Select the year from</td></tr><tr><td>**From Period**</td><td>Select the date from</td></tr><tr><td>**To Year**</td><td>Select the year to</td></tr><tr><td>**To Period**</td><td>Select the date to</td></tr><tr><td>**Project**</td><td>  
</td></tr><tr><td>**Branch**</td><td>  
</td></tr><tr><td>**Shares**</td><td>  
</td></tr></tbody></table>

# Gross Margin Ratio Report

Gross margin ratio report is given on a financial period per month and is worked out by gross margin divided by turnover

[![image.png](https://hugeerp10.co.za/hsofmanual/uploads/images/gallery/2026-04/scaled-1680-/19Mimage.png)](https://hugeerp10.co.za/hsofmanual/uploads/images/gallery/2026-04/19Mimage.png)
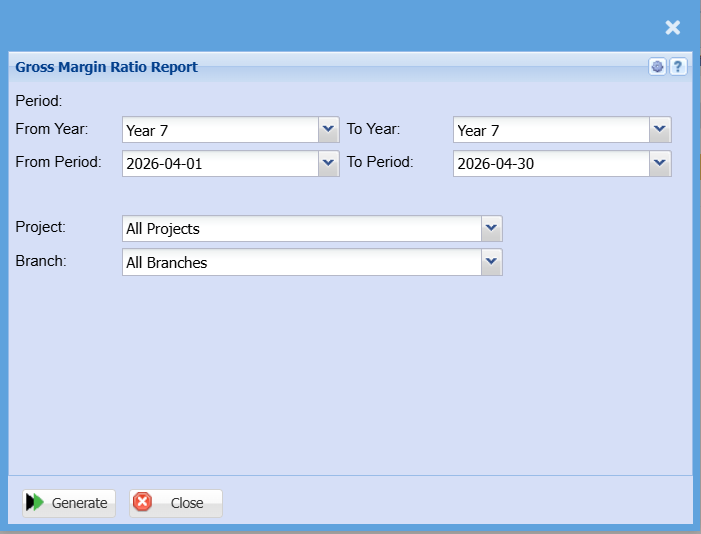
<table border="1" id="bkmrk-from-year-%C2%A0-from-per" style="border-collapse: collapse; width: 100%;"><colgroup><col style="width: 14.2593%;"></col><col style="width: 85.8643%;"></col></colgroup><tbody><tr><td>**From Year**</td><td>select the year from</td></tr><tr><td>**From Period**</td><td>select the date from</td></tr><tr><td>**To Year**</td><td>select the year to</td></tr><tr><td>**To Period**</td><td>select the date to</td></tr><tr><td>**Project**</td><td>  
</td></tr><tr><td>**Branch**</td><td>  
</td></tr></tbody></table>

# Profit Ratio Report

The profit ratio is then worked out per period. The report gives a monthly to yearly summary per financial period to Turnover less Cost of sales giving Gross Profit plus Income less expenses to Nett Profit

[![image.png](https://hugeerp10.co.za/hsofmanual/uploads/images/gallery/2026-04/scaled-1680-/3S5image.png)](https://hugeerp10.co.za/hsofmanual/uploads/images/gallery/2026-04/3S5image.png)
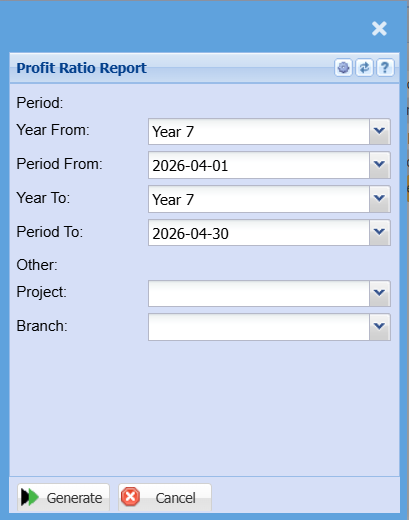
<table border="1" id="bkmrk-year-from-%C2%A0-period-f" style="border-collapse: collapse; width: 100%;"><colgroup><col style="width: 14.5062%;"></col><col style="width: 85.6174%;"></col></colgroup><tbody><tr><td>**Year From**</td><td> </td></tr><tr><td>**Period From**</td><td>  
</td></tr><tr><td>**Year To**</td><td>  
</td></tr><tr><td>**Period To**</td><td>  
</td></tr><tr><td>**Project**</td><td>  
</td></tr><tr><td>**Branch**</td><td>  
</td></tr></tbody></table>