DJC Reports
- Report List
- 00. Overview of Costs and Expenses on a Job
- 01. Job Quote Summary Report
- 02. Job Quote Detail Report
- 03. Quote and Job Status Report
- 10. Job Grouping Report
- 11. Projected Values
- 12. Projected Values
- 13. Job on Hand Value
- 15. Job Managed Costs Report
- 18. WIP Managed Value
- 20. WIP Summary
- 21. Job Stock Managed
- 22. Stock Values in Managed Jobs
- 23. Time Log / Service Hours by Employee
- 24. PO Report
- 25. Job Journals
- 26. Invoiced Job Values
- 27. Job Delivery Note Report
- 28. Job Capture Report
- 29. Job Costing Dates Report
- 30. Job Reserved Inventory Items
- 31. Order No. in use in Other Jobs
- 32. Job Analysis Report
- 33. Job Picked Shortage Report
- 34. Report on Reopened Jobs
- 40. Time Log to Job Checks
- 50. Delivery Note to Credit Note Audit Trail
- 51. All Documents Associated with a Job
- 52. Job Days Completion Report
- 55. Job Delivery Address Report
- 60. Purchase Order Forecast
- 62. Job Purchasing Report
- 70. Job Invoice Profit
- Job Earnings Report
- 72. Invoiced Accounting WIP Cost Difference
- Job Lines to be Invoice
- Job Managed Dimension Report
- 74. Job Profit Status on Percentage Jobs
- 000. Job Overview Summary Report
- Picking Slip Report
- Job costing report differences between Job overview report and Job Invoiced values
Report List
00. Overview of Costs and Expenses on a Job
Job Costing> Reports> Reports List
This report can be run by selecting a Job Number range, a Debtor range or a Date range as the selection criteria working in conjunction with the Job Status options available in the Job Status drop down.
Please Note : When a Job Number range is selected the Date range is disabled.
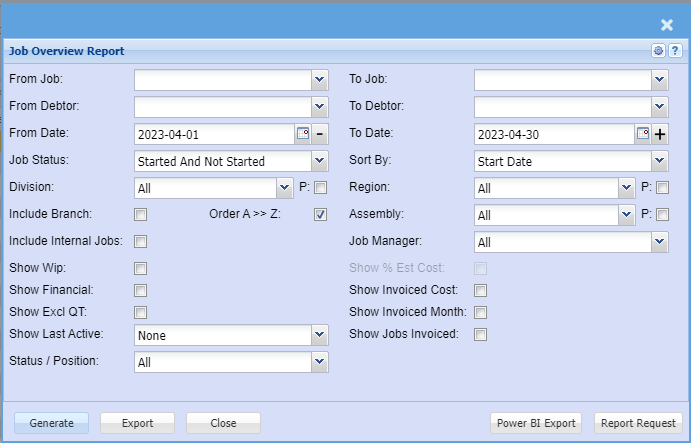
| From Job / To Job | |
| From Debtor / To Debtor | |
| From Date / To Date | |
| Job Status | |
| Division |
Division, region and assembly have options to filter by these cost centres. |
| Include Branch | display branch as a column on the report |
| Include Internal Jobs | This is a flag on the job, by default we exclude internal jobs on report. Put tick on to include them in report |
| Show Wip |
Future Managed Costs on Job – This displays areas in the system that has a job linked to it that has not yet been added to job. a. It looks at documents that are in process or in preparation |
| Show Financial | Shows columns related to sales figures on the job |
| Show Excl QT |
This is a flag on the quotes which flags that the quote values for sell and cost should not be part of the calculation for budget. |
| Show Last Active | |
| Status / Position | |
| Sort By | |
| Region | Division, region and assembly have options to filter by these cost centres. a. There is a P next to each with a tick box which stands for Print – Show as a column on the report to display the relevant cost centre |
| Assembly | Division, Region and Assembly have options to filter by these cost centres. a. There is a P next to each with a tick box which stands for Print – Show as a column on the report to display the relevant cost centre |
| Job Manager | |
| Show % Est Cost | Shows the percentage cost figures from percentage invoices as columns on the report |
| Show Invoiced Cost | displays new columns on the report to show invoiced costs |
| Show Invoiced Month | |
| Show Jobs Invoiced |
- Start date – the start date of the job
2. Est Start Date – Estimated start date which is used to work out the task activities
3. Comp Date – Completion date – the date you want the job to finish – lets say Friday because on Monday to delivery
4. Del Date – Delivery date – the date you want to the job to be delivered
5. Days – the outstanding days from today to completion date
6. Project Manager – the project manager assigned to the job
7. Debtor code – the customer code
8. Debtor name – the customer name
9.Job No – The job number – click on this number to open up the manage job screen
10. Description – the short description of the job
11. Job status – the status of the job – Non Started, Started, Completed, cancelled or closed
13. % Complete – the percentage of completion of the job – Budget versus managed
14. Order No – The customer order number
15. Quote No – The original quote number - Order value - This is the quote sell value of all quotes (excluding quotes flagged as excluded)
2. Planned cost - This is the quote cost value of all quotes (excluding quotes flagged as excluded)
3. Planned Profit - This is the profit of the quote = Order value - Planned cost
4. Managed – Total managed on job – actual managed items
5. Total – The total managed WIP = Future WIP + Total managed
6. Incurred Costs – Displays values of cashbooks and creditors journals linked to the job
7. Job del note – the value of cost in Job delivery note before Job invoice
a.once the delivery note is processed to invoice, value is taken out of this column
8. Job Invoice – the cost of job invoices via Usage job invoice or Percentage job invoice
a.If job is usage – total usage value on invoices processed
b. If job is percentage – the estimated percentage cost value entered by the user
9. Debtor invoice – the cost of the customer invoice done linked to the job
10. Credit note – the cost value of the credit note linked to the job.
| A | Order Value | Selling Value of the quote. |
| B | Planned Cost | Costs as per the quote. |
| C | Profit | Difference between the Order Value and the Planned Cost. |
| D | Stock Requests | All cost values of Stock Requests with the status Requested or Authorised. |
| E | Outstanding Purchase Orders | All cost values of Purchase Orders with the status Created or Authorised. |
| F | GRV To Job | All cost values of GRVs with the status Preparation or Posted. |
| G | Del. Note To Job | All cost values of Delivery Notes with the status Created. |
| H | BOM | All cost values of a BOM item with the status Created, Pending or Active. |
| I | Picking Slips | All cost values of items on Picking Slips that have not been managed. |
| J | Time Sheet WIP | All cost values of items on Job Capture that have not been processed. |
| K | Managed | All cost values of items on a Job that have been managed. |
| L | TOTAL | Sum of A, B, C, D, E, F, G, H, I, J and K |
| M | Incurred Costs | All GL Cash Books and Creditor Journals that have been posted linked to the job. |
| N | Job Delivery Note | All cost values of items on a Job Delivery Note. |
| O | Job Invoice | All cost values of items on a Job Invoice. |
| P | Debtor Invoice | All cost values of items on a Debtor Invoice with the status Posted. |
| Q | Credit Note | All cost values of items on a Debtor Credit Note with the status Posted |
| R | Outstanding Turn Over | A - (O + P - Q) |
| S | Future Costs | B – L |
| T | Future Profit | B – K |
01. Job Quote Summary Report
Job Costing> Reports> Reports List
This report shows quotes in various status levels with cost, selling and profits to be made.
It gives an indication of the estimated profit on a quote
It takes the cost values at the time of creating the quote and fixes them when moving to the job.
costs might vary when managing the actual job.
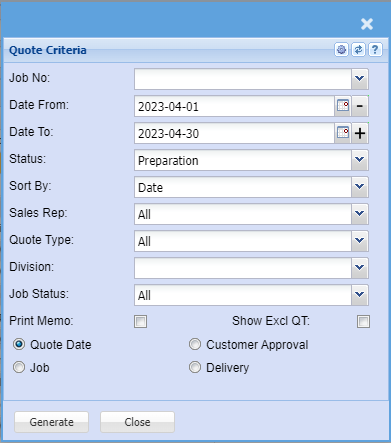
| Job No. | |
| Date From / To | |
| Status | |
| Sort By | |
| Sales Rep | |
| Quote Type | |
| Division | |
| Job Status | |
| Print Memo | |
| Show Excl QT | |
| Quote |
02. Job Quote Detail Report
Job Costing>Reports>Reports List
This report shows quote details in various status levels with costs and selling values.
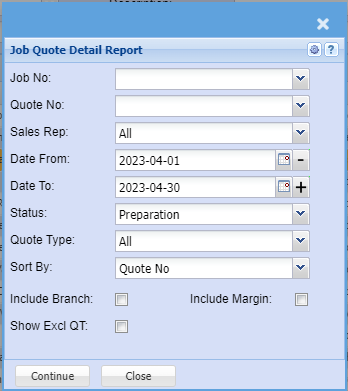
| Job No. | |
| Quote No | |
| Sales Rep | |
| Date From and To | |
| Status | |
| Quote Type | |
| Sort By | |
| Include Branch | |
| Include Margin | |
| Show Excl QT |
03. Quote and Job Status Report
Job Costing>Reports>Reports List
Report displaying Job related data based on quote selection criteria
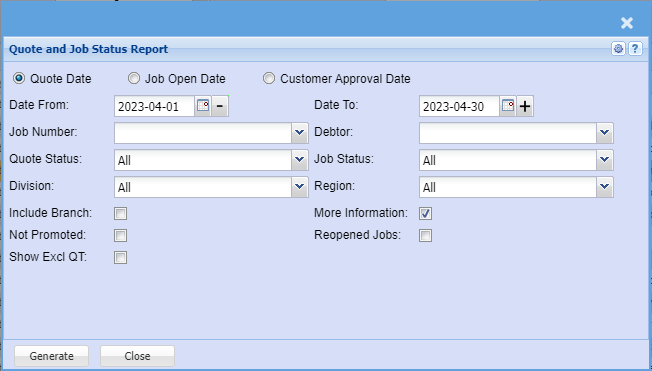
| Quote Date | |
| Job Open Date | |
| Customer Approval Date | |
| Date From and To | |
| Job Number | |
| Quote Status | |
| Division | |
| Include Branch | |
| Not Promoted | |
| Show Excl QT | |
| Debtor | |
| Job Status | |
| Region | |
| More Information | |
| Reopened Jobs |
10. Job Grouping Report
Job Costing>Reports>Reports List
Job grouping report allows a selection to view quantity, cost or selling of jobs and compares
quote, usage and invoiced values with balance.
To run the report, select the customer, job number or the date.
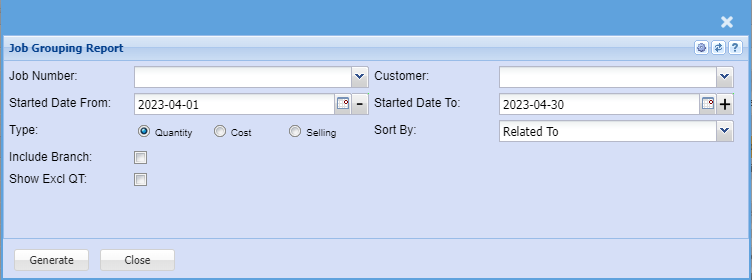
| Job Number | |
| Customer | |
| Started Date From and To | |
| Type | Select the type of the report. (Quantity, Cost or Selling) |
| Sort By | Sort the report by selecting any from the drop down arrow. |
| Include Branch | |
| Show Excl QT |
11. Projected Values
Job Costing>Reports>Reports List
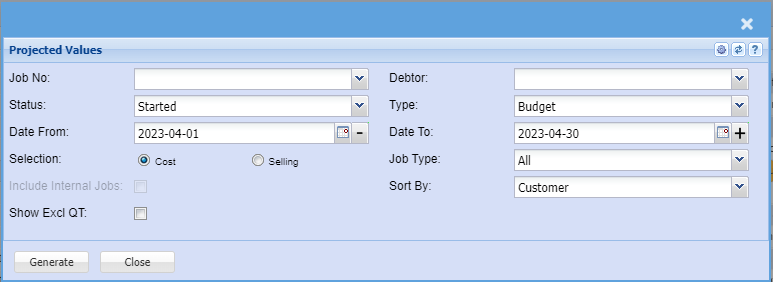
| Job No | |
| Status | |
| Date From and To | |
| Selection | Select either Cost or Selling |
| Include Internal Jobs | |
| Show Excl QT | |
| Debtor | |
| Type | |
| Job Type | |
| Sort By |
12. Projected Values
Job Costing>Reports>Reports List
This report is the same as the above report except that this compares different types example.
Also gives a percentage completion.
Excellent to view from quote to Actual completed.
| a. | Budget vs Actual |
| b. | Budget vs Invoiced |
| c. | Actual vs Invoiced |
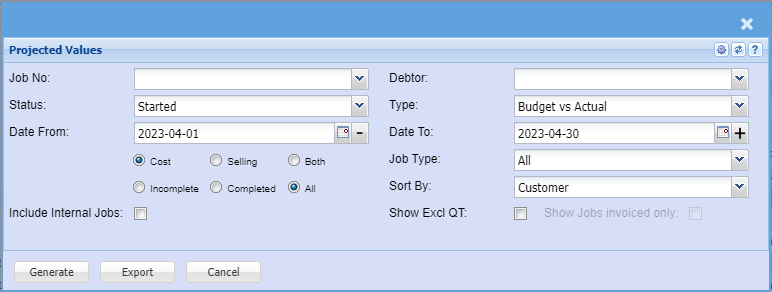
Same as projected values report with completion percentage.
To run the report, select from the following fields:
| Job No | select the job number or leave it blank |
| Status | select the status from the drop down arrow |
| Date From and To | select the date from and the date to |
| Select from the following: |
Select either Cost or Selling or Both Select to run Incomplete or Complete or All reports the reports |
| Include Internal Jobs | |
| Debtor | select the debtor or leave it blank |
| Type | select the type from the drop down arrow |
| Job Type | |
| Sort By | sort the report by selecting a customer, date, description, job number or quote number from the drop down arrow. |
| Show Excl QT | |
| Show Jobs invoiced only |
13. Job on Hand Value
Job Costing>Reports>Reports List
Job on hand value will give you the value based on either cost or selling on the job
It gives you the comparison with
| a. | Budget - Quote |
| b. | Actual - WIP – quantity that was used on the Job |
| c. | Invoiced - Amounts invoiced on the job |
| Action | Conditions | |
| Exclude Zero | 1. | Job Not started and value is Zero. |
| 2. | Job started and Budgeted value is Zero and Invoiced value is Zero. | |
| 3. | Job started and Budgeted value is equal to Invoiced value. |
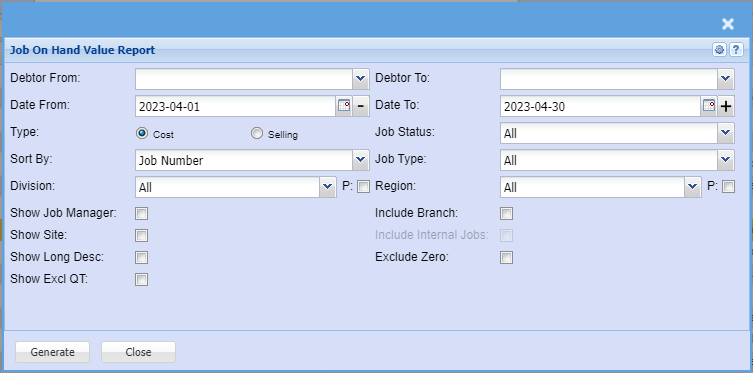
This report allows the user to view the summary of Job value either by cost or selling for budget, Actual and invoiced in a list of all jobs
| Debtor From and To | Select the debtor from and debtor to, for a quick or specific report. |
| Date From and To | Select the date from and the date to for a quick or specific report. |
| Type | Select the type of the report , either cost or selling. |
| Sort By | Sort the report by selecting from the drop down arrow. |
| Division | |
| Show Job Manager | |
| Show Site | |
| Show Long Desc. | |
| Show Excl QT | |
| Job Status | Select the status from the drop down arrow |
| Job Type | |
| Region | |
| Include Branch | |
| Include Internal Job | |
| Exclude Zero |
15. Job Managed Costs Report
Job Costing>Reports>Reports List
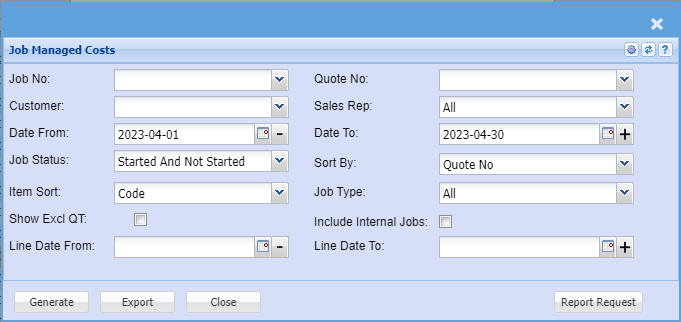
| Job No | |
| Customer | |
| Date From and To | |
| Job Status | |
| Item Sort | |
| Show Excl QT | |
| Line Date From and To | |
| Quote No | |
| Sales Rep | |
| Sort By | |
| Job Type | |
| Include Internal Jobs |
18. WIP Managed Value
Job Costing>Reports>Reports List
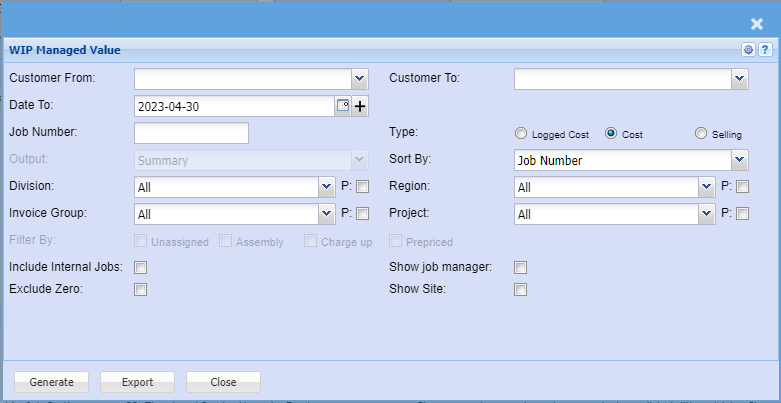
| Customer From and To | |
| Date To | |
| Job Number | |
| Output | |
| Division | |
| Invoice Group | |
| Filter By | Select Unassigned, Assembly, Charge up, Prepriced |
| Include Internal Jobs | |
| Exclude Zero | |
| Type | Select Logged Cost, Cost or Selling |
| Sort By | |
| Region | |
| Project | |
| Show Job Manager | |
| Show Site |
20. WIP Summary
Job Costing>Reports>Reports List
WIP Summary will give you the value or quantity on the job and compares this to the Budgeted (Quote) to Actual (WIP) that has been completed on the Job.
Allows one to view a single job either by quantity or value per item of what has been budgeted versus the actual and the balance difference.
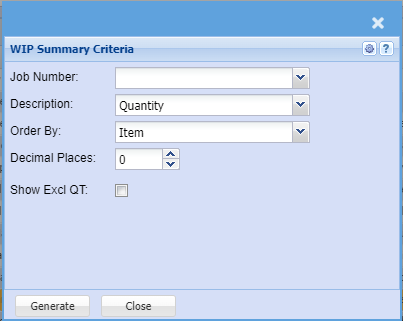
This report allows one to view a single job either by quantity or value per item of what has been budgeted
versus the actual and the balance difference
| Job Number | |
| Description | |
| Order By | |
| Decimal Places | |
| Show Excl QT |
21. Job Stock Managed
Job Costing>Reports>Reports List
This report shows what stock is on hand, how much stock is in WIP and how much stock has been used on the report
Reports only on stock items which shows the amount of stock in WIP and how much has been managed. Reports only per job.
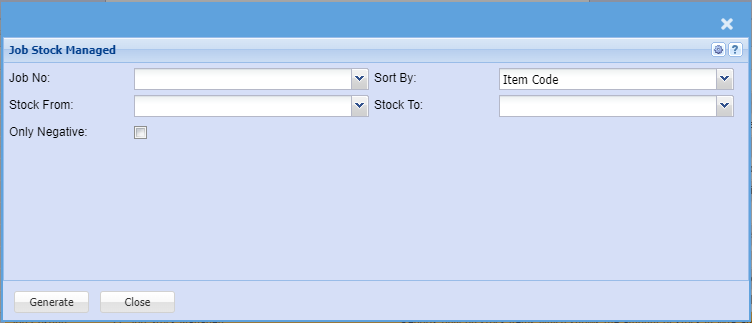
Reports only on stock items which shows the amount of stock in WIP and how much has been
managed.
| Job No | to select the Job number |
| Sort By | Sort the report by selecting one from the drop down arrow |
| Stock From and To | select stock from and the Stock To or leave blank to pull all the stock for the report. |
| Only Negative | to include negative jobs |
22. Stock Values in Managed Jobs
Job Costing>Reports>Reports List
The report shows all stock items that have been used on the job.
What has been invoiced and what was in Reserved quantity
If the invoiced quantity equals the Reserved quantity it means that the stock has been removed from the WIP section.
Shows all stock items that have being managed on jobs between specified dates. It will give the quantity multiplied by the cost to give the total value that is currently being managed on Jobs.
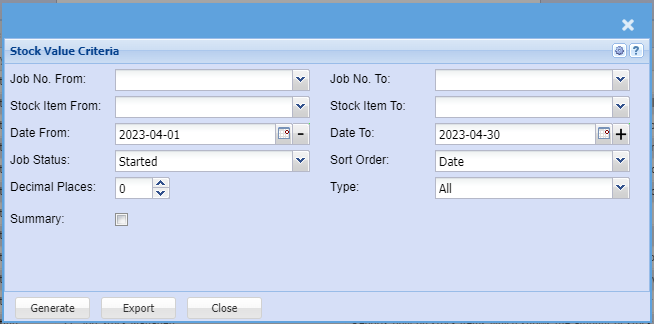
| Job No. From and To | |
| Stock Item From and To | |
| Date From and To | |
| Job Status | |
| Sort Order | |
| Decimal Places | |
| Type | |
| Summary |
23. Time Log / Service Hours by Employee
Job Costing>Reports>Reports List
This will show the hours done by an employee on a job comparing the Budgeted (Quote) hours done to the Actual Hours done
Gives a report on employee hours worked on a list of different jobs. Shows the budgeted versus actual hours and balance done.
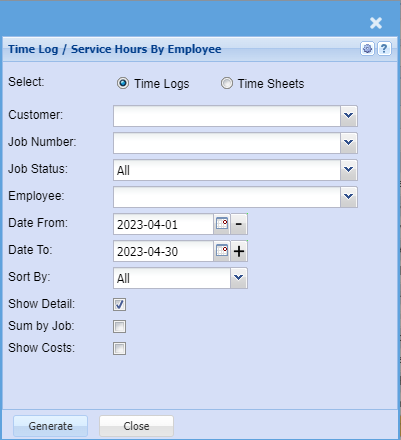
| Select | Select Time Logs or Time Sheets |
| Customer | |
| Job Number | |
| Job Status | |
| Employee | |
| Date From and To | |
| Sort By | |
| Show Detail | |
| Sum by Job | |
| Show Costs |
24. PO Report
Job Costing>Reports>Reports List
This report will show you stock which is sitting in Purchase Order which is relevant to a Job.
In the Job Number section enter the Job number
You can run this report
| a. | Summary |
| b. | Detail |
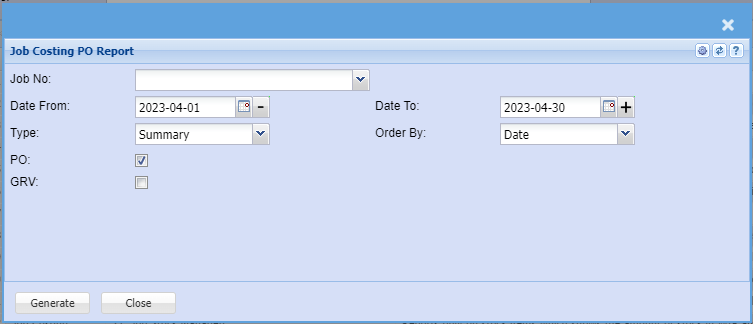
Shows the report on Purchase Orders waiting to go to a specific job. Report is group by Job
Number and shows various POs against that job number.
| Job No | select the job number for the report |
| Date From and To | Select the Date From and the Date To |
| Type | Select the type from the drop down arrow |
| Order By | Select the Order By from the drop down arrow |
| PO | Include the PO by ticking the box |
| GRV | Include the GRV by ticking the box |
25. Job Journals
Job Costing>Reports>Reports List
This report shows transactions processed to ledger accounts via
| a. | Creditors transactions / Journals |
| b. | General Ledger Journals |
| c. | General Ledger Cashbooks |
This report shows the additional value of expenses that is added to each job from other documents like GL Cashbooks.
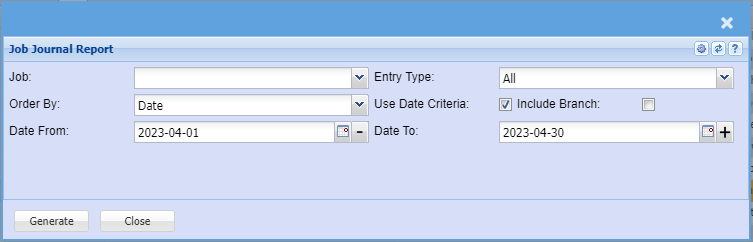
This report shows the additional value of expenses that is added to each job from other
documents like GL Cashbooks.
| Job | |
| Entry Type | |
| Order By | |
| Use Date Criteria | Use Date Criteria option allows the user to select the date or make it visible, if not selected, the date will be greyed out. |
| Include Branch | |
| Date From and To |
26. Invoiced Job Values
Job Costing>Reports>Reports List
This report shows all invoices done over a period of months and gives you links to open the invoices right down to the detail of the invoice
Shows the total value of Jobs invoiced per period in a table format with totals.

| From Year and To Year | |
| Date From and To | |
| Sort By | |
| Select | |
| Show Job Division | |
| Show Job Region | |
| Show Job Invoice Group | |
| Show Excl QT | |
| Job Type | |
| Invoice Type | |
| Include Jobs not Invoiced | |
| Include Branch | |
| Include Internal Jobs |
27. Job Delivery Note Report
Job Costing>Reports>Reports List
Shows all delivery notes against a job
Shows Job Delivery Notes.
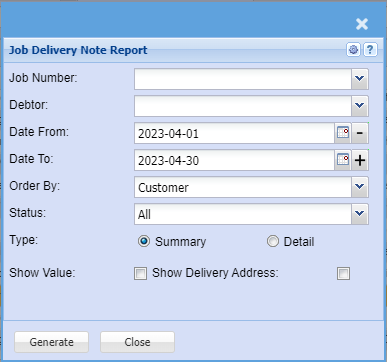
| Job Number | |
| Debtor | |
| Date From and To | |
| Order By | |
| Status | |
| Type | |
| Show Value | |
| Show Delivery Address |
28. Job Capture Report
Job Costing>Reports>Reports List
This gives you a report on all Job captured items against a job
List of Jobs Captured
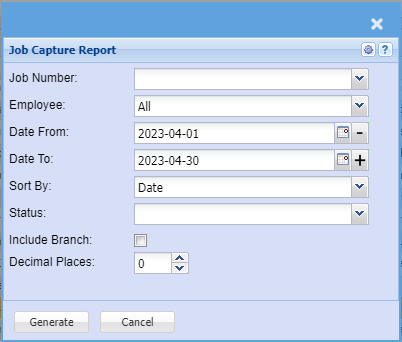
| Job Number | |
| Employee | |
| Date From and To | |
| Sort By | |
| Status | |
| Include Branch | |
| Decimal Places |
29. Job Costing Dates Report
Job Costing>Reports>Reports List
This report looks at the dates of the line items of stock items for different due dates
Job Costing Dates Report - Order Date, Required Date or Reminder Date And Filtered By Payment Method
e.g. COD, 30 Days, 60 Days, 90 Days, 120 Days, 150 Days, 180 Days
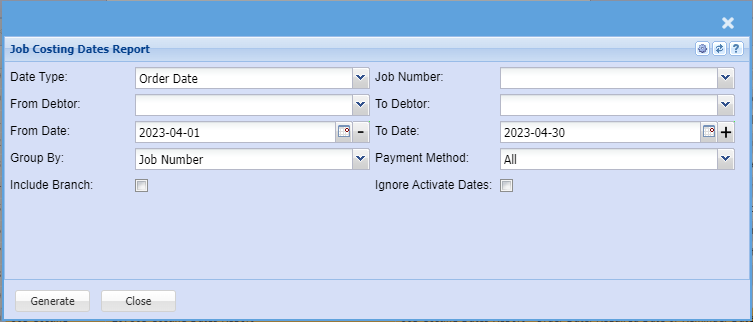
| Date Type | |
| Job Number | |
| From Debtor and To | |
| Date From and To | |
| Group By | |
| Payment Method | |
| Include Branch | |
| Ignore Activate Dates |
30. Job Reserved Inventory Items
Job Costing>Reports>Reports List
This shows what items are sitting in the WIP account.
It means that items have been reserved against a job but not yet invoiced.
This is also different from what is actually been used on the job
In the example we have here, we have actually used 2 items on this job.
2 items moved into WIP but then 1 got invoiced. When it was invoiced it was taken out of the WIP account and out of the system.
Report displays all inventory items reserved against Jobs
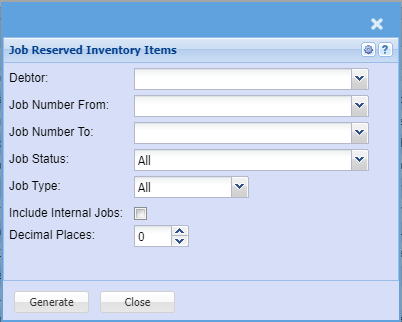
| Debtor | |
| Job Number From and To | |
| Job Status | |
| Job Type | |
| Include Internal Jobs | |
| Decimal Places |
31. Order No. in use in Other Jobs
Job Costing>Reports>Reports List
Search and report on order numbers in use in various jobs.
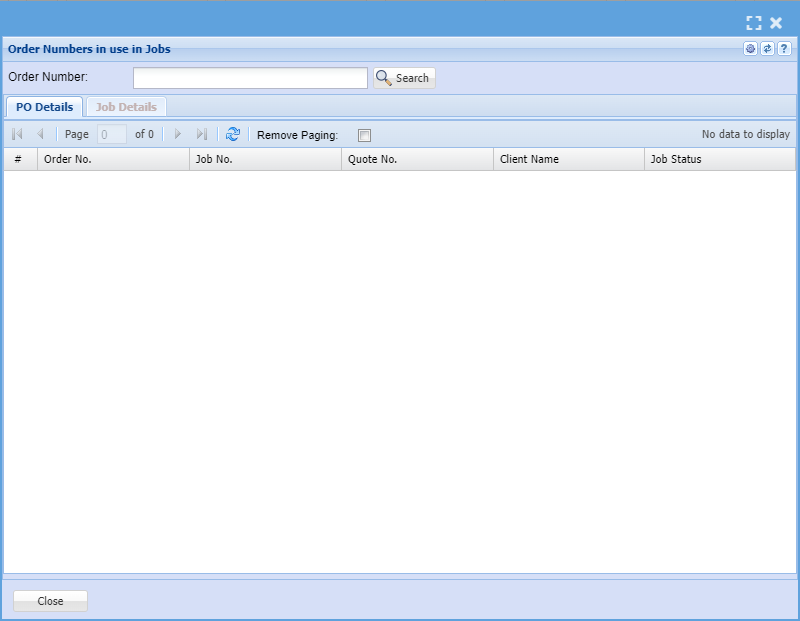
| Order Number | Enter the order number to search on, then click on search button. |
Search and report on order numbers in use in various job.
PO Details tab shows all the Po details for that order number
Job Details tab has two tabs:
Job lines tab – Job lines for a selected PO
Quotes tab – quotes lines for the same selected PO
Close button closes the form
32. Job Analysis Report
Job Costing>Reports>Reports List
Reports cost selling and profit per job
Job Analysis running summary
This can be viewed in different categories.
| a. | Quote |
| b. | Managed |
| c. | Invoiced |
| d. | Quote vs Invoiced. |
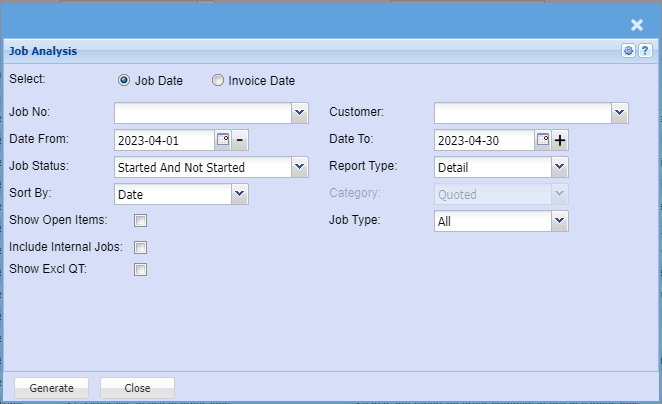
| Select | |
| Job No | |
| Date From and To | |
| Job Status | |
| Sort By | |
| Show Open Items | |
| Include Internal Jobs | |
| Show Excl QT | |
| Customer | |
| Report Type | |
| Category | |
| Job Type |
33. Job Picked Shortage Report
Job Costing>Reports>Reports List

| Group Report By | |
| Job Status | |
| Date From and To | |
| Job No From and To | |
| Item From and To | |
| Decimal Places |
34. Report on Reopened Jobs
Job Costing>Reports>Reports List
Report on Reopened Jobs that are still open.
All reopened Jobs option allows the user to view all the jobs reopened if selected and the date
options disappear.
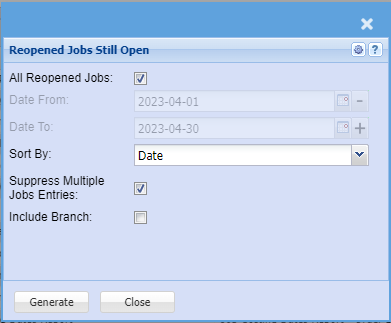
| All Reopened Jobs | |
| Date From and To | |
| Sort By | Sort the report by selecting any option from the drop-down arrow. |
| Suppress Multiple Jobs Entries | Suppress Multiple Jobs Entries option include the jobs that were opened several if unselected. |
| Include Branch |
40. Time Log to Job Checks
Job Costing>Reports>Reports List
This report checks time logs to jobs for exceptions for Time logs onto Jobs.
If you are not able to see this report, please add to your security for report role permissions.
Found under System Configuration Security Module
If the same time log exists in the same job, then I want to see the time logs
If the same time log exists in manage job but in separate jobs, we will accept that the duplicate is OK and I don’t need to see that on the report
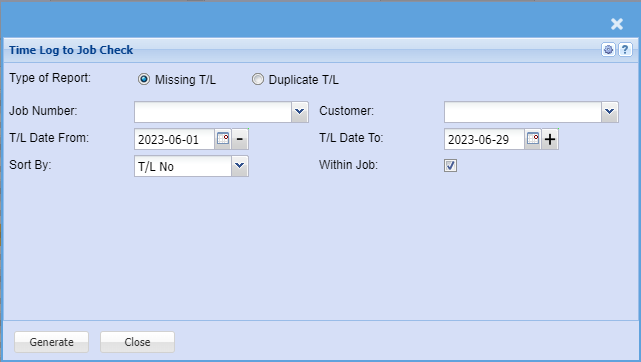
| Type of Report |
There are two options to check for missing time logs not on a job and duplicate time logs on a job
Missing Time logs
Duplicate Time logs Date range is specific to the date of the log entry onto the job |
| Job Number | So the query is similar to duplicate T/L if we selected a job number. However it just runs across all jobs and checks duplicates within each job and gives result set |
| T/L Date From | |
| Sort By | |
| Customer | |
| T/L Date To | |
| Within Job |
50. Delivery Note to Credit Note Audit Trail
Job Costing>Reports>Reports List
Shows the audit trial of a delivery note and document numbers linked to that delivery note.
This report shows all delivery notes and documents which proceeded the delivery note and the status of this
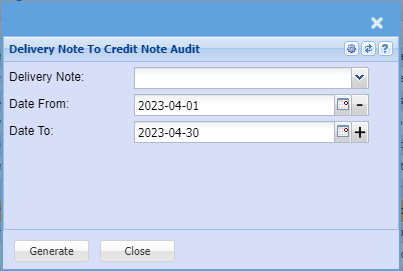
| Delivery Note | |
| Date From and To |
51. All Documents Associated with a Job
Job Costing>Reports>Reports List
This report shows all documents associated with a job
Jobs can have multiple
| a. | Quotes |
| b. | Delivery Notes |
| c. | Invoices |
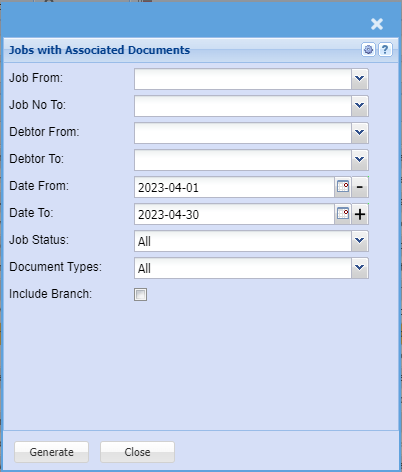
| Job From | |
| Job No To | |
| Debtor From and To | |
| Date From and To | |
| Job Status | |
| Document Types | |
| Include Branch |
52. Job Days Completion Report
Job Costing>Reports>Reports List
This report shows how many days a job has to completion as well as the percentage complete based on either
| a. | Cost |
| b. | Selling |
| c. | Quantity |

| Job No | |
| Date From and To | |
| Job Status | |
| Completion Date | |
| Days More | |
| Completion Percentage | |
| Include Branch |
55. Job Delivery Address Report
Job Costing>Reports>Reports List
This report shows the delivery address for the selected Jobs
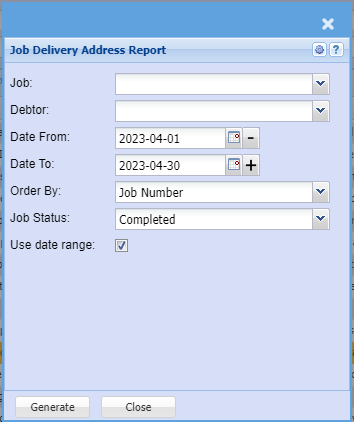
| Job | This is there if you want to print the delivery address for a specific job number |
| Debtor | Select the customer related to the jobs if applicable |
| Date From and To | Select the date range for the information that should be displayed. |
| Order By | Choose in which order the data should be displayed |
| Job Status | Is the job started, cancelled, completed, etc. |
| Use date range | Use the dates specified by the date from and date to |
60. Purchase Order Forecast
Job Costing>Reports>Reports List
It is a report that shows a forecast of purchase orders broken into number of days.
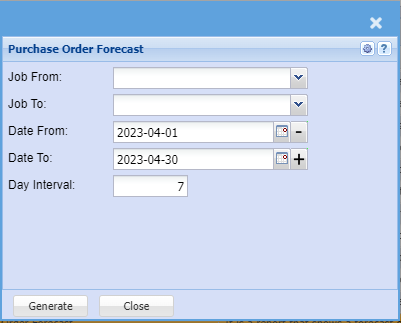
| Job From and To | |
| Date From and To | |
| Day Interval |
62. Job Purchasing Report
Job Costing>Reports>Reports List
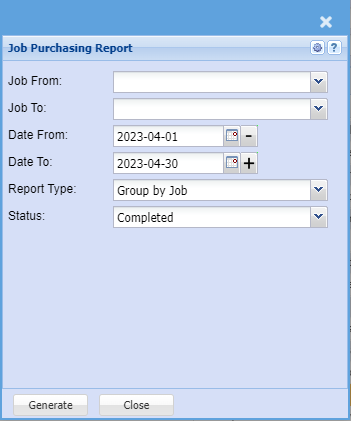
| Job From and To | |
| Date From and To | |
| Report Type | |
| Status |
70. Job Invoice Profit
Job Costing>Reports>Reports List
Use this report to workout how much you've invoiced to date and how much the job has accumulated in costs.
It shows the net profit between the two and allows you to workout whether you are under invoicing a job.
You can filter this report by job number, customer or job status.
If you leave the field blank for the job number and the customer it will search on all.
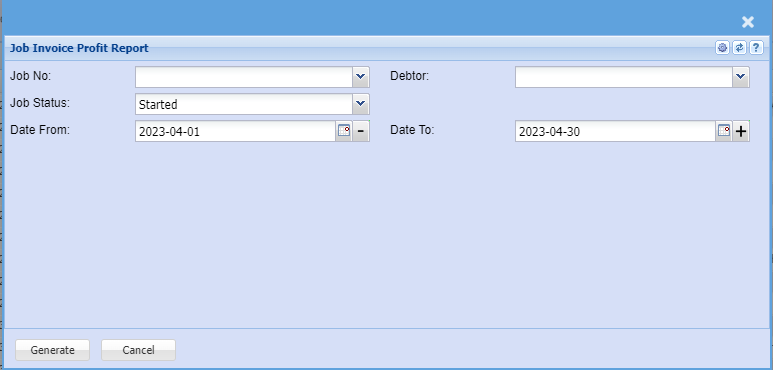
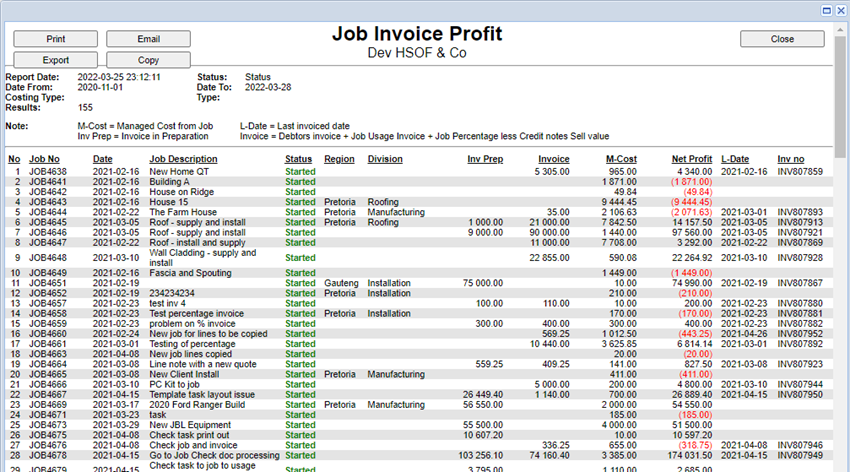
The net profit he's worked out as follows
Invoice preparation plus invoices less managed costs on job equals net profit.
Invoice values are represented based on the selling price of invoices processed.
It has worked out as follows.
Debtors invoices plus job usage invoices plus job percentage invoices less credit notes.
M-Cost is defined as managed or usage on a managed job
The report will also show the last date and invoice number that was processed on the job.
Job Earnings Report
Job Costing> Reports> Reports List
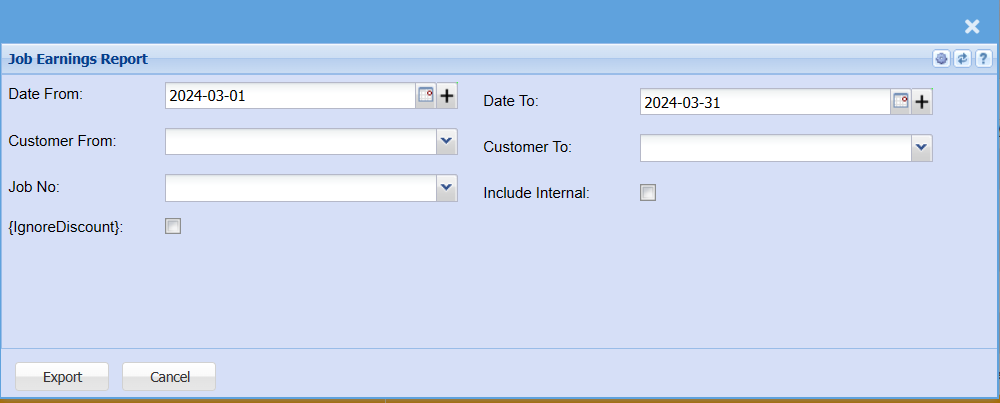
| Date From and To | |
| Customer From and To | |
| Job No | |
| Include Internal | |
| IgnoreDiscount |
72. Invoiced Accounting WIP Cost Difference
Job Costing>Reports>Reports List
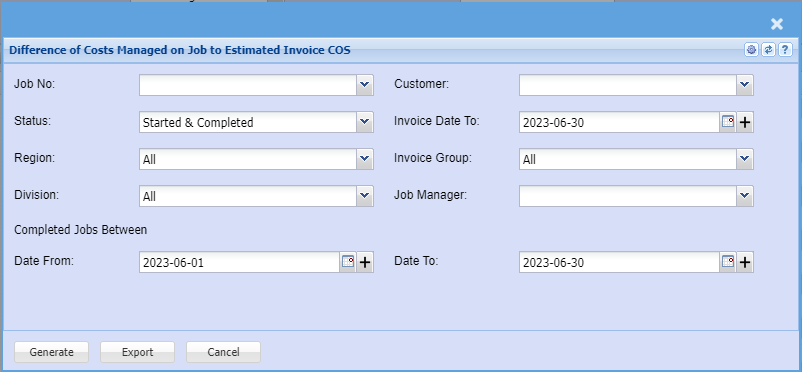
| Job No | |
| Status | |
| Region | |
| Division | |
| Completed Jobs Between | |
| Customer | |
| Invoice Date to | |
| Invoice group | |
| Job Manager | |
| Date From and To |
Job Lines to be Invoice
Job Costing>Reports>Reports List

| Job No | |
| Debtor |
Job Managed Dimension Report
Job Costing> Reports> Reports List
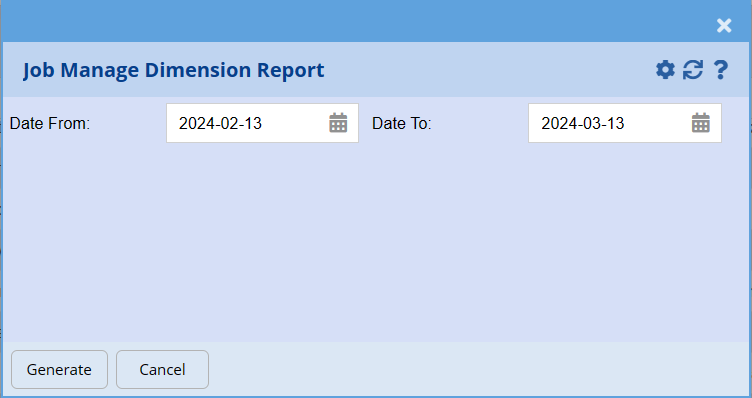
| Date From and To |
74. Job Profit Status on Percentage Jobs
Job Costing>Reports>Reports List

| Job No | |
| Status | |
| Region | |
| Division | |
| Completed Jobs Between | |
| Customer | |
| Invoice Date to | |
| Invoice group | |
| Job Manager | |
| Date From and To |
000. Job Overview Summary Report
Job Costing>Reports>Reports List

| From Job and To | |
| From Debtor and To | |
| From Date and To | |
| Job Status | |
| Sort By |
Picking Slip Report
Picking Slip
Job Costing>Reports>Picking Slip Report
View – Opens the currently selected Picking Slip to either view or change the information within.
Print – Prints the currently selected Picking Slip.
.png)
Job costing report differences between Job overview report and Job Invoiced values
The difference between the invoiced report and the Job overview report and the tick for show invoiced month.
It is because JOB6232 has backdated invoice on the 31 August 2022, but Job was started on the 01 September 2022.
This is creating a conflict between the values between the reports.
.png)
Explanation
Date from and Date to is based on job started date.
In the above criteria, we are looking for all jobs from 2000 to end of August 2022 that are started within that period.
This is first criteria that brings jobs to the report
Then it looks at the Show invoiced month tick which will look at the Date to.
This takes the jobs filtered and adds the invoiced values of invoices done in that month.
Because the job started on 01 September 2022 it is not included in the report.
.png)
The report 26. For Invoiced Job values for the month of August.
This ignores the dates the jobs are started or type of status.
It looks at jobs invoiced in that month and shows the jobs for that month.
This why the job appears on this report and not the other
The new tick on the report
This tick runs the same logic as report 26. Invoiced Job values
It ignores the start date of the jobs and looks at jobs that are invoiced in the Date to Month.
This is why there is a difference in the value, because now it picks up the job that was back dated with an invoice on 31 August 2022.
If the invoice was not back dated to before the job start date, there would not have been a difference in the reports.
.png)
To eliminate the problem of a job start date, you can force a back dated start date.
You can only do this if the job is in a non-started status.
As soon as something is managed on a job, it will take the current date as the job started date.
Once this occurs you cannot change the started date.