Please Note: This report will typically take a long time to render due to the calculations and the size of the inventory data.
[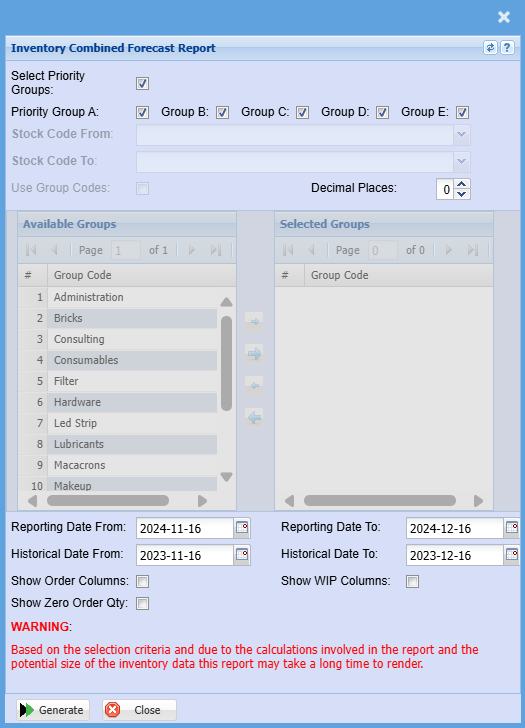](https://hugeerp10.co.za/hsofmanual/uploads/images/gallery/2024-12/p7jimage.png)| **All Priority Groups** | By default, when the report criteria window opens all the Priority Groups are selected, by clicking on the Select Priority Groups tick box they can be unselected and selected. When unselected individual Groups can be selected or unselected. Unselecting Select Priority Groups enables the Stock Code From and the Stock Code To drop downs as well as the Use Group Codes tick box |
| **Stock code From / To** | Select a stock item you wish to search from. If you leave the stock item fields blank, all stock items will be displayed on the report. If you choose specific stock items, the report will sort information by stock item code rather than description. Select the start stock code and the end stock code for the report. |
| **Use Group Code** | Double click on the code from the list to move the group codes you wish to filter your report by to the selected window. |
| **Reporting Date From** | Reporting Date from is the date range to calculate the recent sales quantities of stock items e.g. the last three months. |
| **Historical Date From** | Historical Date from is the date range to calculate historical sales that will be used to compare and calculate the forecast stock quantities. |
| **Show Order Columns** | Put a tick on to show order columns |
| **Show Zero Order Columns** | Put a tick on to show zero order columns |
| **Decimal Places** | It is advisable to set decimals to two places. You can View the report with any number of decimal places. |
| **Show WIP Columns** | Put a tick on to show WIP columns |
| **Generate Button** | Click the "Generate" button to open the report You will have options to copy, email, or print the report To view the report in an Excel document, copy the report and paste it into an Excel file |