Report List Inventory
- Analysis of Monthly Sales Figures
- BOM - Distribution of Inventory Items in BOMS
- BOM Stock Allocation List
- BOM Forecast
- BOM Report
- BOM Usage
- BOM Value Report
- Custom Fields Report
- Debtor Warehouse Report
- Inventory Age Analysis
- Inventory Analysis of Movement
- Inventory Analysis of Movement by Group Codes etc.
- Inventory by Group
- Inventory Combined Forecast Report
- Inventory Cost Methods
- Inventory Costs
- Inventory Count
- Inventory Forecast Report
- Inventory Group Percentage Profit
- Inventory Last Used Report
- Inventory Listing Report
- Inventory Slow Movers
- Inventory Summary Report
- Inventory Transactions
- Inventory Valuation
- Inventory Valuation Summary
- Inventory WIP Breakdown
- Margin Percentage Exception Report
- BOM Recipe List Report
- Sales Order Stock Items
- Stock Control Report
- Stock Count Sales Analysis
- Stock Location and Weight
- Stock Movement Per Month
- Stock Purchasing Forcast By Brands Report
- Stock Purchasing Forecast Report
- Stock Request Report
- Supplier Inventory Quantity
- Supplier Price Listing
- Valuation of Fixed Assets
- Valuation of Fixed Assets Version 2
- Warehouse Levels
- Warehouse Transfer Detail
- Inventory Item Price Report
Analysis of Monthly Sales Figures
Analysis of Monthly Sales figures - Showing Costs and Profit
Inventory module> Reports> Reports List
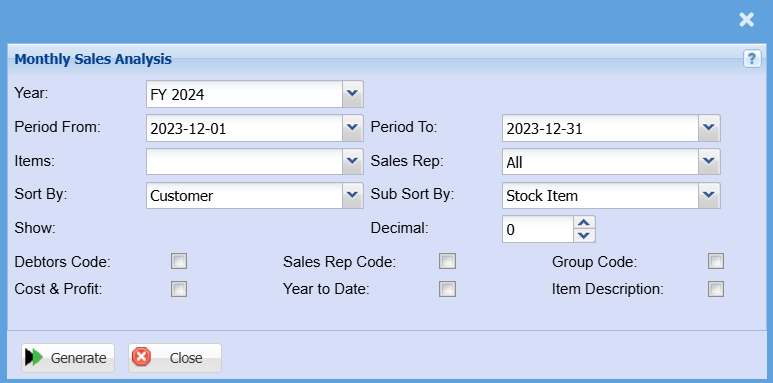
| Year | Select a financial year you are running the report for |
| Period From / Period To | Select the period From and the period to from the drop-down arrow |
| Items | Select an item you wish to run the report for or leave it blank to run by all items |
| Sales Rep |
If you leave the sales rep on all the report will run by all sales rep If you want to run a report by a specific sales rep, then you will need to select the sales rep on the drop down menu selection |
| Sort By |
Sort the report by selecting one option from the drop-down arrow. Options area: by Code, Description, Group Code or Bin Location |
| Sub Sort By |
Select the sort option from the drop down arrow |
| Decimal |
It is advisable to set decimals to two places You can view the report with any number of decimal places. |
| Customer Code | Put the tick on for the report to display customer codes in a separate column |
| Cost & Profit | Put the tick on for the report to display cost and profit in a separate column |
| Sales Rep Code | Put the tick on for the report to display sales rep code in a separate column |
| Year to Date | Put the tick on for the report to display year to date in a separate column |
| Group Code | Put the tick on for the report to display group codes in a separate column |
| Generate Button |
Click the "Generate" button to open the report You will have options to copy, email, or print the report To view the report in an Excel document, copy the report and paste it into an Excel file |
BOM - Distribution of Inventory Items in BOMS
Distribution of inventory items in BOMS Report
Inventory module> Reports> Reports List
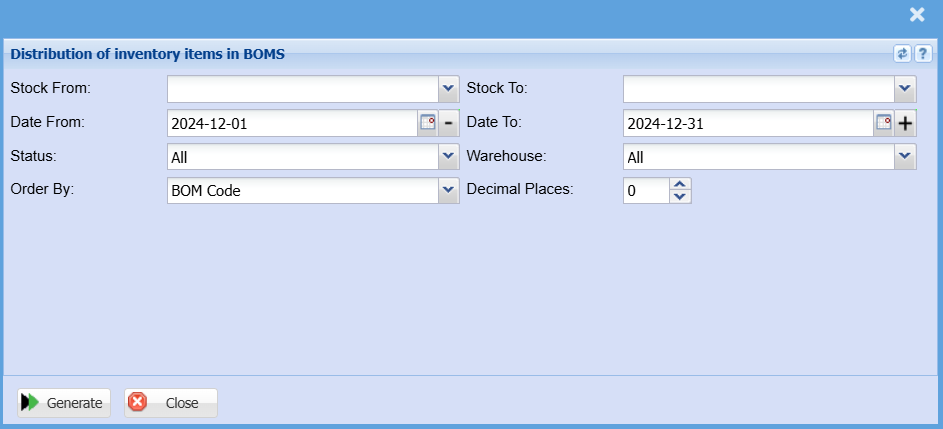
| Stock From / Stock To |
Select a item you would like to view the report from and a stock item where the report should stop If you leave the stock item fields blank, all stock items will be displayed on the report If you choose specific stock items, the report will sort information by stock item code rather than description |
| Date From / Date To |
Choose the date range for which you want to view the report Select the date from on the menu drop down selection Select a date range of when you want to see the report to |
| Status |
If you select all the report will pull all statuses If you want to view report by status, select the status on the drop-down selection |
| Warehouse |
If you select all warehouses the report will fetch data from all warehouses. If you want to search by a specific warehouse, select the warehouse from the menu. |
| Order By | Select order by on the drop-down menu selection |
| Decimal Places |
It is advisable to set decimals to two places. You can View the report with any number of decimal places. |
| Generate Button |
Click the "Generate" button to open the report You will have options to copy, email, or print the report To view the report in an Excel document, copy the report and paste it into an Excel file |
BOM Stock Allocation List
Inventory module>Reports> Reports List
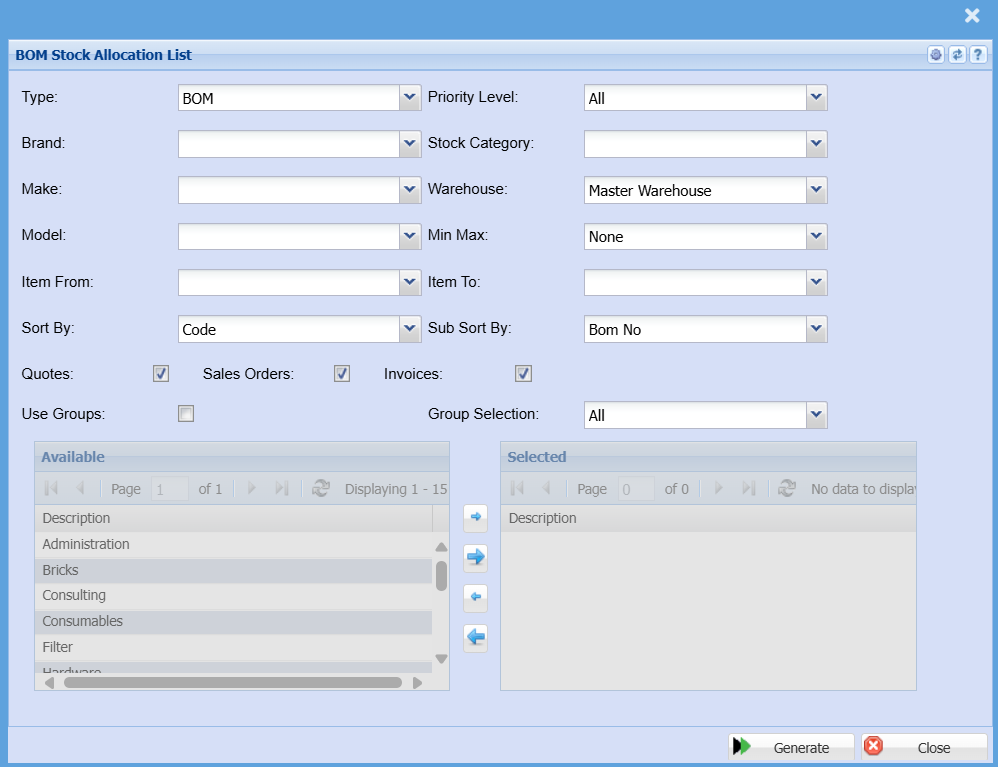
| Type | Type allows you to refine your report to only show Item BOM, Stock or you can select to show both. |
| Brand | When working with multiple branches this drop-down allows the user to select a specific branch to pull a report for. |
| Make | Select the Make from the drop-down menu to refine your search for your report. |
| Model | Select the Model from the drop-down menu to refine your search for your report. |
| Item From /Items To |
Select an item you would like to view the report from and To, from the stock item where the report should start and end. If you leave the stock item fields blank, all stock items will be displayed on the report. If you choose specific stock items, the report will sort information by stock item code rather than description. |
| Sort By | Choose from the drop-down menu how you would like your report sorted, your options are by Code, Description or Group. |
| Priority Level | Select priority level of the report from the drop-down menu |
| Stock Category | To generate the report, the user has to select the stock category from the drop-down menu eg: Fixed assets, Hardware, stationary. These categories will need to have been setup. |
| Warehouse |
If you select all warehouses the report will fetch data from all warehouses If you want to search by a specific report, select the report on the warehouse selection |
| Min Max |
Select Min/Max on you want to run your report by or leave it on none if you do not wish to filter the report by min/max |
| Sub Sort By | Sub Sort the report by selecting one option from the drop-down menu allows the user to pull a report with a secondary criteria that will be sorted by either, Code, Description or group. |
| Quotes / Sales Orders / Invoices | Put a tick on a document(s) you wish to run the report by |
| Use Groups |
Put a tick on if you want to pull a report with selected group codes from the grid. |
| Group Selection | Select group from the drop-down menu |
| Generate Button |
Click the "Generate" button to open the report You will have options to copy, email, or print the report To view the report in an Excel document, copy the report and paste it into an Excel file |
BOM Forecast
Shows the BOM created on all status on the quantity requested versus what was created, activated, posted and the balances left.
Inventory module> Reports> Reports List
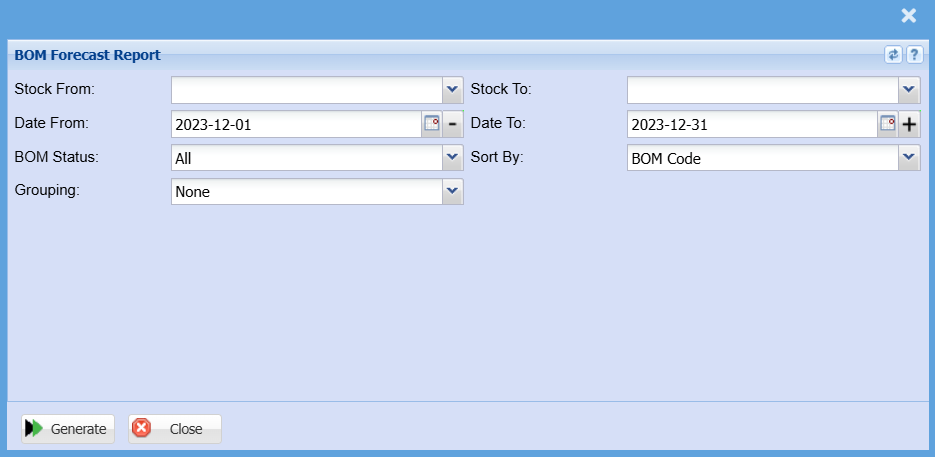
| Stock From / Stock To |
If you leave the stock item fields blank, all stock items will be displayed on the report. If you choose specific stock items, the report will sort information by stock item code rather than description. Select a stock Item on the drop-down menu. |
| Date From / Date To |
Choose the date range for which you want to view the report from Select a date range of when you want to see the report to |
| BOM Status |
If you select all the report will pull all statuses If you want to view report by status, select the status on the drop-down selection |
| Sort By | Select sort criteria for the report on the drop-down menu selection |
| Grouping |
Select grouping of the report from the drop-down menu If you don't wish to group your report leave the selection on none |
| Generate Button |
Click the "Generate" button to open the report You will have options to copy, email, or print the report To view the report in an Excel document, copy the report and paste it into an Excel file |
BOM Report
A detailed report showing each BOM created with recipe of the quantity and cost price created.
Inventory module> Reports> Reports List
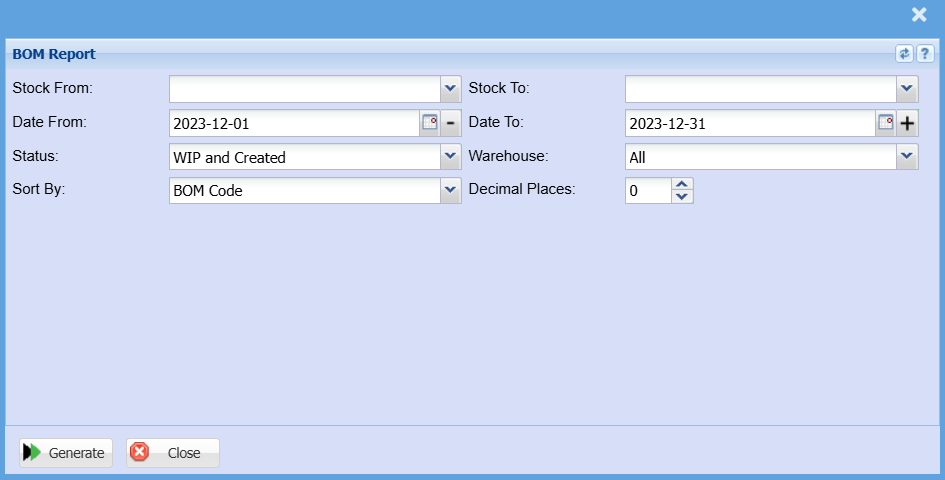
| Stock From / Stock To |
If you leave the stock item fields blank, all stock items will be displayed on the report If you choose specific stock items, the report will sort information by stock item code rather than description Select the stock item you wish your report to end |
| Date From / Date To |
Choose the date range for which you want to view the report from Select a date range of when you want to see the report to |
| Status |
If you select all the report will pull all statuses If you want to view report by status, select the status on the drop-down selection |
| Warehouse |
If you select all warehouses the report will fetch data from all warehouses. If you want to search by a specific warehouse, select the warehouse from the menu. |
| Sort By | Select sort criteria for the report on the drop-down menu selection |
| Decimal Places |
It is advisable to set decimals to two places You can view the report with any number of decimal places. |
| Generate Button |
Click the "Generate" button to open the report You will have options to copy, email, or print the report To view the report in an Excel document, copy the report and paste it into an Excel file |
BOM Usage
A summary report showing each BOM created with its recipe of the quantity and cost price created.
Inventory module>Reports> Reports List
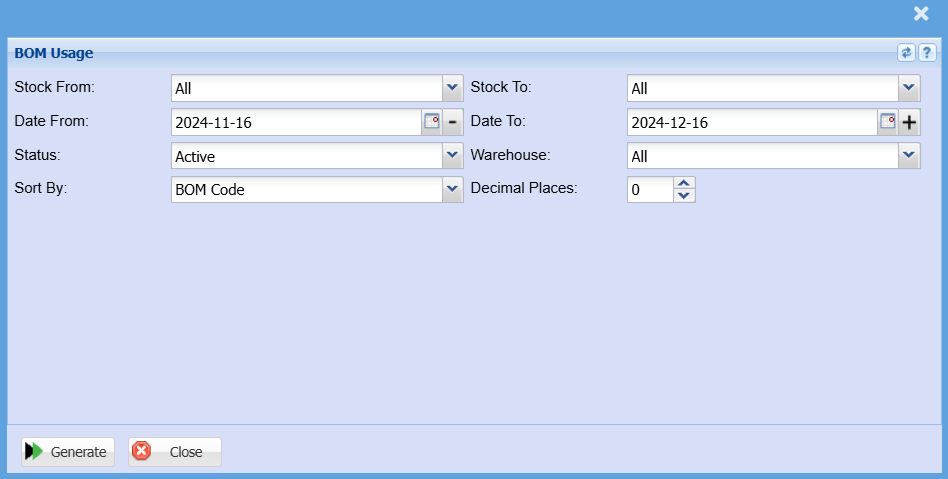
| Stock From / Stock To |
Select a stock item you wish to search from. If you leave the stock item fields blank, all stock items will be displayed on the report. If you choose specific stock items, the report will sort information by stock item code rather than description. Select the start stock code and the end stock code for the report. |
| Date From / Date To |
Choose the date range for which you want to view the report from Select a date range of when you want to see the report to |
| Status |
If you select all the report will pull all statuses If you want to view report by status, select the status on the drop-down selection |
| Warehouse |
If you select all warehouses the report will fetch data from all warehouses. |
| Sort By | Select sort criteria for the report on the drop-down menu selection |
| Decimal Places |
It is advisable to set decimals to two places. You can View the report with any number of decimal places. |
| Generate Button |
Click the "Generate" button to open the report You will have options to copy, email, or print the report To view the report in an Excel document, copy the report and paste it into an Excel file |
BOM Value Report
Inventory module>Reports> Reports List
Summary report showing the stock, service and custom type items values for each BOM and total value of the BOM.
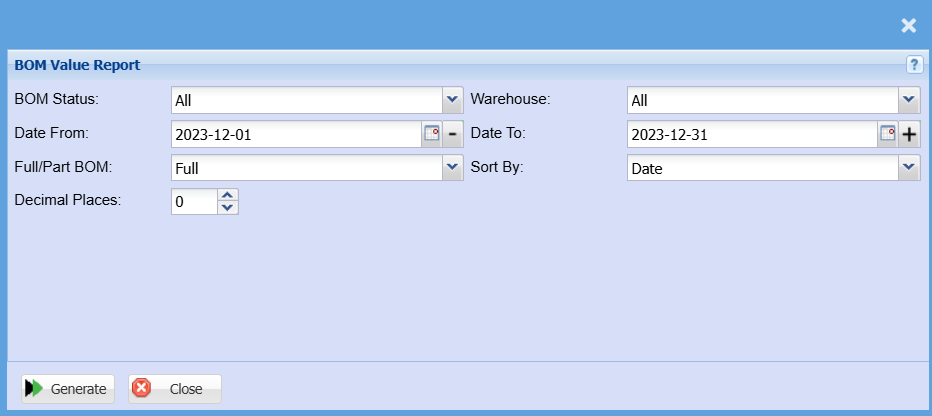
| BOM Status |
Leave a report criteria on all to search for all BOM statuses If you wish to view a report by a specific BOM status, select the BOM status from drop down selection |
| Date From / To |
Choose the date range for which you want to view the report from. |
| Full / Part BOM | Select which BOM you wish to display on your report |
| Decimal Places |
It is advisable to set decimals to two places You can view the report with any number of decimal places. |
| Warehouse |
If you select all warehouses the report will fetch data from all warehouses. If you want to search by a specific warehouse, select the warehouse from the menu. |
| Sort By | Select what you wish to sort your report by on the drop-down menu |
| Generate Button |
Click the "Generate" button to open the report You will have options to copy, email, or print the report To view the report in an Excel document, copy the report and paste it into an Excel file |
Custom Fields Report
When setting up custom fields against inventory items, run a report showing the list and cost of each item for the selected custom field.
Inventory module> Reports> Reports List
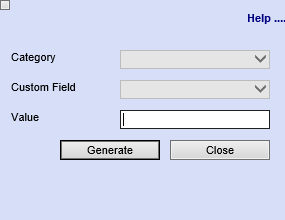
| Category | To generate the report the report, the user has to select the category from the drop down menu |
| Custom Field | Select a custom field from the drop down selection |
| Value | Enter a value |
| Generate Button |
Click the "Generate" button to open the report You will have options to copy, email, or print the report To view the report in an Excel document, copy the report and paste it into an Excel file |
Debtor Warehouse Report
Report on Stock Item as per debtor from the debtor warehouse.
Inventory module> Reports> Reports List
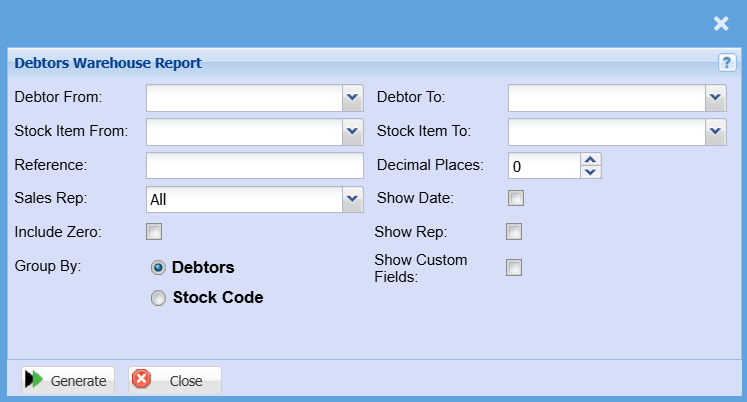
| Debtor From / To |
Select a Customer/Debtor you wish to view the report from. Select the Customer/Debtor you wish to see up to in the report. |
| Stock Item From / To |
Select a stock item you wish to search from. If you leave the stock item fields blank, all stock items will be displayed on the report. If you choose specific stock items, the report will sort information by stock item code rather than description. Select the start stock code and the end stock code for the report. |
| Reference | Add a reference to search a report by |
| Sales Rep |
Select a sales rep on the drop-down menu If you wish to run a report on all sales reps, let it on All |
| Include Zero | Put a tick on to include items that have zero quantity |
| Group By | select either Debtor or Stock Code |
| Decimal Places |
It is advisable to set decimals to two places You can view the report with any number of decimal places. |
| Show Date | Put a tick on to show date in a separate column |
| Show Rep | Put a tick on to show a sales rep in a separate column |
| Show Custom Fields | Put a tick on to show custom fields in a separate column |
Inventory Age Analysis
Gives movement - In and Out - of Inventory Items based on the Audit date and Time
Inventory age analysis shows how many times the average inventory quantity is used in a given period
Inventory module> Reports> Reports List
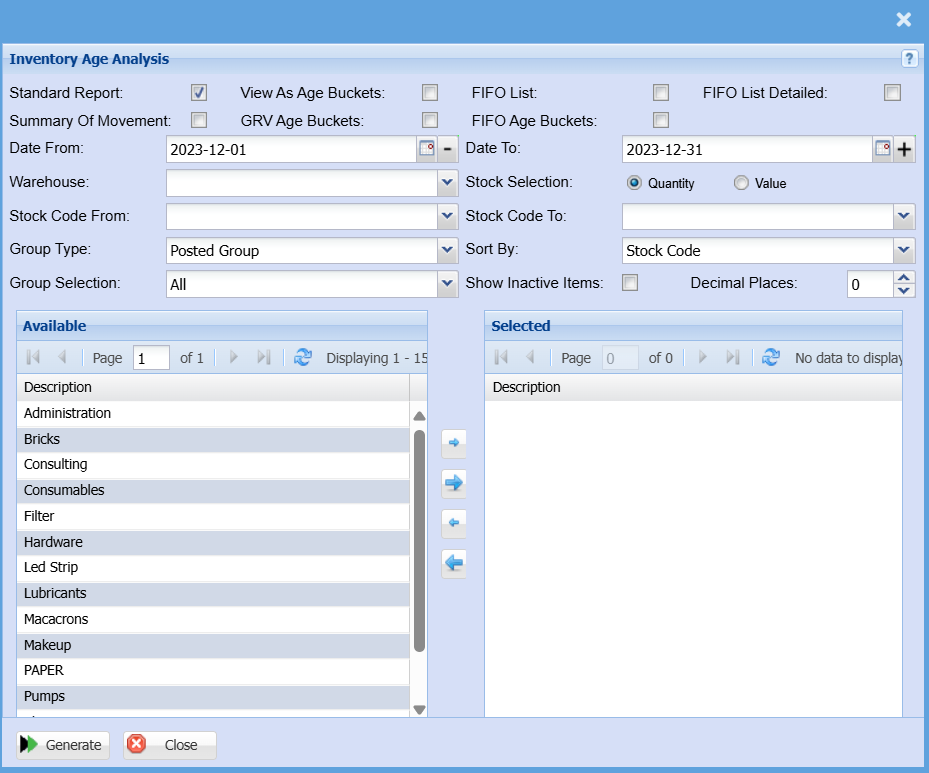
| Standard Report | Put a tick on if you wish to generate a standard report |
| View As Age Buckets |
When selecting this option, the group code option will only filter the group code and not group by them |
| Summary of Movement | Put a tick on if you only want to see summary of movement on your report and not a detailed |
|
GRV Age Buckets |
Put a tick on to view GRV age buckets on the report |
| Date From / To |
Choose the date range for which you want to view the report from. Select a date range of when you want to see the report to. |
| Warehouse |
If you select all warehouses the report will fetch data from all warehouses. If you want to search by a specific warehouse, select the warehouse from the menu. |
|
Stock Code From / To |
Select a stock item you wish to search from. If you leave the stock item fields blank, all stock items will be displayed on the report. If you choose specific stock items, the report will sort information by stock item code rather than description. Select the start stock code and the end stock code for the report. |
|
Group Type |
Select group type on the drop-down arrow |
|
Group Selection |
Double click on the code from the list to move the group codes you wish to filter your report by to the selected window. |
|
FIFO List |
Put a tick on if you wish for a report to show the First In First out summary |
| FIFO Detailed | Put a tick on if you wish for a report to show First In First Out details |
|
Stock Selection |
Choose a stock selection between quantity and value |
|
Sort By |
Choose from the drop-down menu how you would like your report sorted, your options are by Stock Code or Stock Description. |
|
Show Inactive Items |
Put a tick on to show inactive items in your report |
| Decimal Places |
It is advisable to set decimals to two places You can view the report with any number of decimal places |
| Generate Button |
Click the "Generate" button to open the report You will have options to copy, email, or print the report To view the report in an Excel document, copy the report and paste it into an Excel file |
Inventory Analysis of Movement
Inventory Analysis of movement per financial period grouped by Inventory Items or by Debtor or Creditor
Inventory module> Reports> Reports List
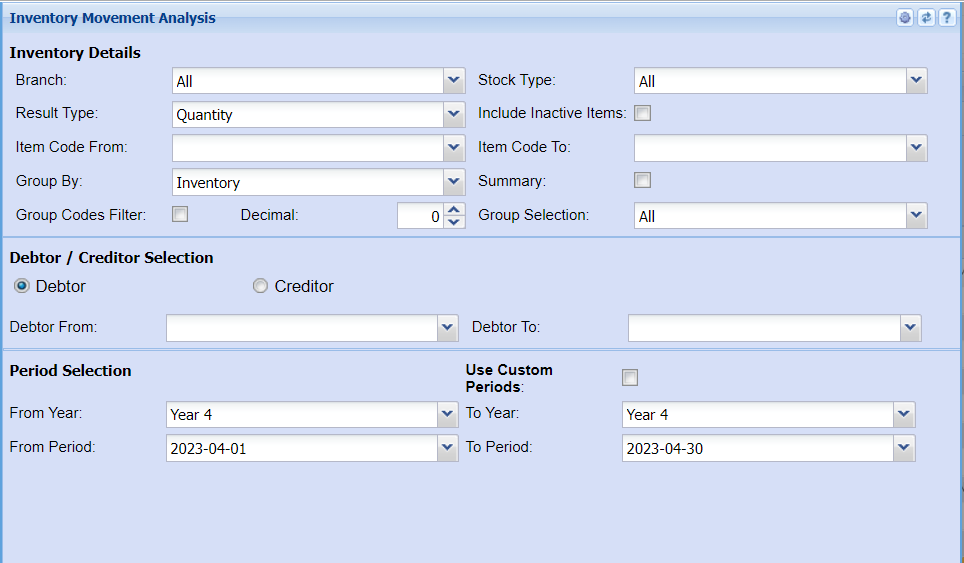
Inventory Details
| Branch |
Select the branch you wish to run the report by from the drop-down arrow If you wish to run a report on all branches leave it on all |
| Result Type | Select a result type on the drop-down menu selection |
| Item Code From / To |
Select a stock item you wish to search from. If you leave the stock item fields blank, all stock items will be displayed on the report. If you choose specific stock items, the report will sort information by stock item code rather than description. Select the start stock code and the end stock code for the report. |
| Group By | The report can be grouped by selecting one option from the group by drop down arrow |
| Group Codes Filter | Put a tick on if you wish to filter the report by group codes |
| Decimal |
It is advisable to set decimals to two places You can view the report with any number of decimal places. |
| Stock Type | Select a stock type from the drop-down selection |
| Include Inactive Items | Put a tick on if you wish to display inactive items on your report |
| Summary |
If you put the tick on the report will only pull limited information |
| Group Selection | Select a group on the drop-down menu |
Debtor / Creditor Selection
| Debtor | You need to select debtor if you wish to run the report by debtor/customer |
| Creditor | You need to select a creditor if you wish to run the report by creditor/supplier |
| Debtor From / To |
Select a Customer/Debtor you wish to view the report from. Select the Customer/Debtor you wish to see up to in the report. |
Period Selection
| Use Custom Periods | Put a tick on to use custom fields |
| From Year / To Year |
Select the financial year you wish to pull your report from and a financial year you wish to stop at |
| From Period / To Period | Select the period From and the period to from the drop-down menu |
Inventory Analysis of Movement by Group Codes etc.
Inventory Analysis of Movement Grouped by Group Codes, Inventory / Debtor or Creditor
This is a report on inventory analysis of movement grouped by group code, inventory/ debtor or
creditor
Inventory module> Reports> Reports List
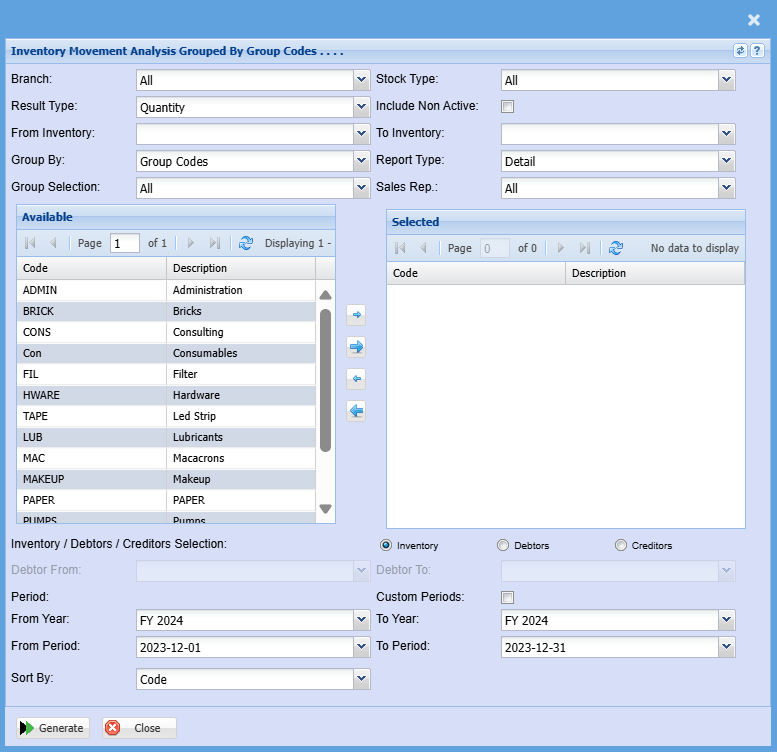
| Branch | When working with multiple branches this drop-down allows the user to select a specific branch to pull a report for. |
| Result Type | To select the results type from the drop-down menu, your options are Quantity, Sales Value or Sales Cost. |
| From Inventory / Inventory To | If you leave the stock item fields blank, all stock items will be displayed on the report. If you choose specific stock items, the report will sort information by stock item code from and to the selected codes rather than description. |
| Group By | Select from the drop-down menu if you want to pull your report by a specific group, you can choose from Group Code or Group Code / Inventory item. |
| Group Selection | Double click on the code from the list to move the group codes you wish to filter your report by to the selected window. |
| Stock Type | Select the stock type from the drop-down menu |
| Include Non Active Tick | Put a tick on to include all inactive stock items |
| Report Type | Report Type allows the user to select either detail or summary from the drop-down arrow. |
| Sales Rep |
If you leave sales rep on all the report will run by all sales rep If you want to run a report by a specific sales rep, then you will need to select the sales rep on the drop-down menu selection |
| Inventory / Debtor / Creditor Selection | This allows you to choose if you want to run a report by debtor/customer or by supplier/creditor |
| Debtor From / Debtor To |
Select a Customer/Debtor you wish to view the report from. Select the Customer/Debtor you wish to see up to in the report. |
| Year From / Year To | Select the year From and Year To Dates from the drop-down menus will show results specific to the period you have selected. |
| Period From / Period To | Select the period From and the period to from the drop-down menu |
Inventory by Group
This report shows the sales sold, per period selected, of the quantity and value per invoice, per line.
Inventory module> Reports> Reports List
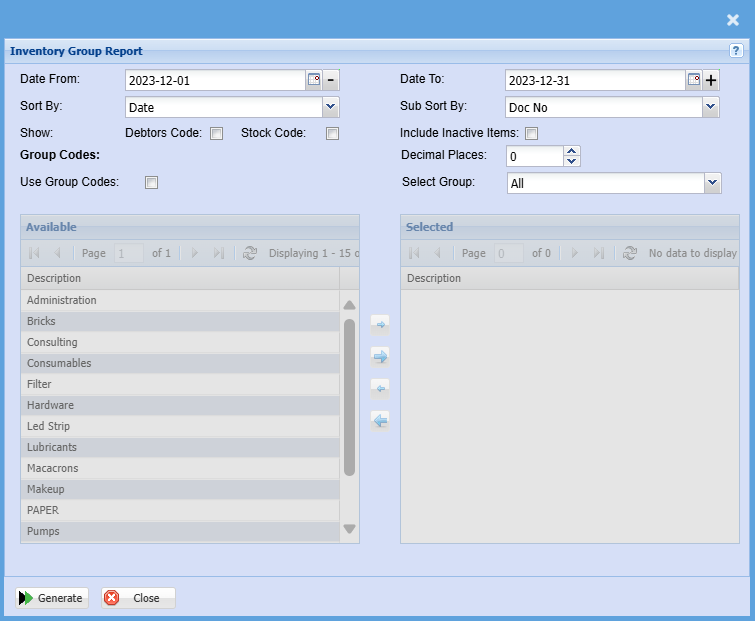
| Date From / Date To |
Select a Customer/Debtor you wish to view the report from. Select the Customer/Debtor you wish to see up to in the report. |
| Sort By | Sort the report by selecting one option from the drop-down menu selection |
| Sub Sort By | Select the sort by option from the drop-down menu selection |
| Show Debtor Code / Stock Code | Put a tick on if you would like to show debtor codes or stock codes |
| Use Group Codes | Double click on the code from the list to move the group codes you wish to filter your report by to the selected window. |
| Include Inactive Items | Put a tick on if you wish to include inactive items |
| Decimal Places |
It is advisable to set decimals to two places You can view the report with any number of decimal places. |
| Select Group | Select a group selection on the drop-down |
| Generate Button |
Click the "Generate" button to open the report You will have options to copy, email, or print the report To view the report in an Excel document, copy the report and paste it into an Excel file |
Inventory Combined Forecast Report
Calculates and forecasts inventory quantities based on the selection criteria and date range.
Inventory module> Reports> Reports List
Please Note: This report will typically take a long time to render due to the
calculations and the size of the inventory data.
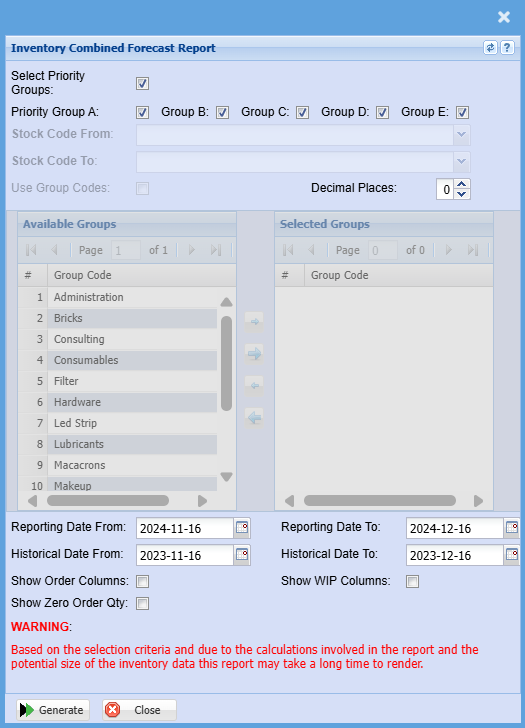
| All Priority Groups |
By default, when the report criteria window opens all the Priority Groups are selected, by clicking on the Select Priority Groups tick box they can be unselected and selected. When unselected individual Groups can be selected or unselected. |
| Stock code From / To |
Select a stock item you wish to search from. If you leave the stock item fields blank, all stock items will be displayed on the report. If you choose specific stock items, the report will sort information by stock item code rather than description. Select the start stock code and the end stock code for the report. |
| Use Group Code | Double click on the code from the list to move the group codes you wish to filter your report by to the selected window. |
| Reporting Date From | Reporting Date from is the date range to calculate the recent sales quantities of stock items e.g. the last three months. |
| Historical Date From | Historical Date from is the date range to calculate historical sales that will be used to compare and calculate the forecast stock quantities. |
| Show Order Columns | Put a tick on to show order columns |
| Show Zero Order Columns | Put a tick on to show zero order columns |
| Decimal Places |
It is advisable to set decimals to two places. You can View the report with any number of decimal places. |
| Show WIP Columns | Put a tick on to show WIP columns |
| Generate Button |
Click the "Generate" button to open the report You will have options to copy, email, or print the report To view the report in an Excel document, copy the report and paste it into an Excel file |
Inventory Cost Methods
Inventory> Reports> Reports List
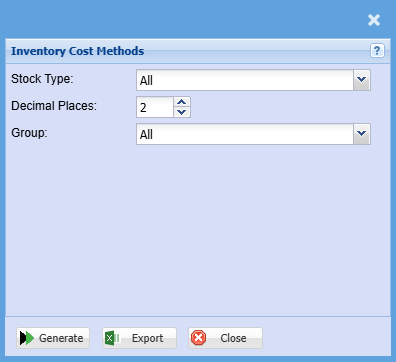
| Stock Type | Select the stock type from the drop-down arrow |
| Decimal Places |
It is advisable to set decimals to two places. You can View the report with any number of decimal places. |
| Group |
If you leave the group codes on all, the report will pull all group codes Select a code if you wish to run a report by a specific group code |
| Generate Button |
Click the "Generate" button to open the report You will have options to copy, email, or print the report To view the report in an Excel document, click copy on the report and past it into an Excel file |
| Export Button | This allows you to export your report to an Excel file |
Inventory Costs
This shows the pricing level indicated against the stock item, what cost is being utilized as well as the markup or amount on the item.
Inventory module> Reports> Reports List
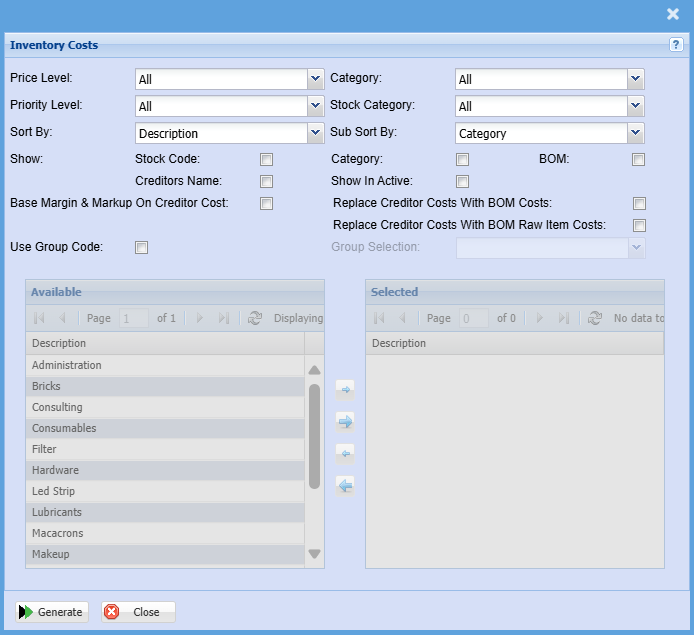
| Price Level | Select a priority level on the drop-down menu |
| Priority Level | Count based on the Priority level of marked items |
| Sort By | Choose from the drop-down menu how you would like your report sorted, your options are by Description, Code, Category, Price Level or Stick Category. |
| Sub Sort By | Sub Sort the report by selecting one option from the drop-down menu allows the user to pull a report with a secondary criteria that will be sorted by either, Description, Code, Category, Price Level or Stick Category. |
| Show | Put a tick on to show any of the criteria with tick boxes |
| Category | To generate the report, the user has to select the category from the drop-down menu |
| Stock Category | Select a stock category on the drop-down menu |
| Use Group Code |
Double click on the code from the list to move the group codes you wish to filter your report by to the selected window. |
| Generate Button |
Click the "Generate" button to open the report You will have options to copy, email, or print the report To view the report in an Excel document, copy the report and paste it into an Excel file |
Inventory Count
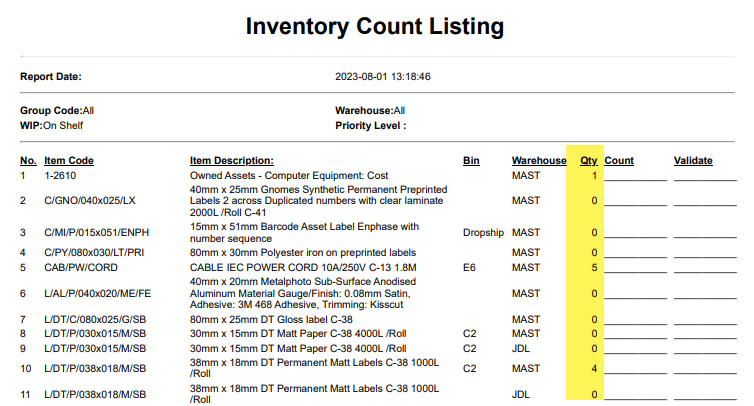
Report displays a list of items which show what quantity is on hand currently and a space where the person counting can indicate the quantity actually counted.
Generally, a count is done without giving what the quantity is on hand, however if you want to see the quantity on hand, remove the tick off the option called "Ignore system quantity"
Inventory module> Reports> Reports List
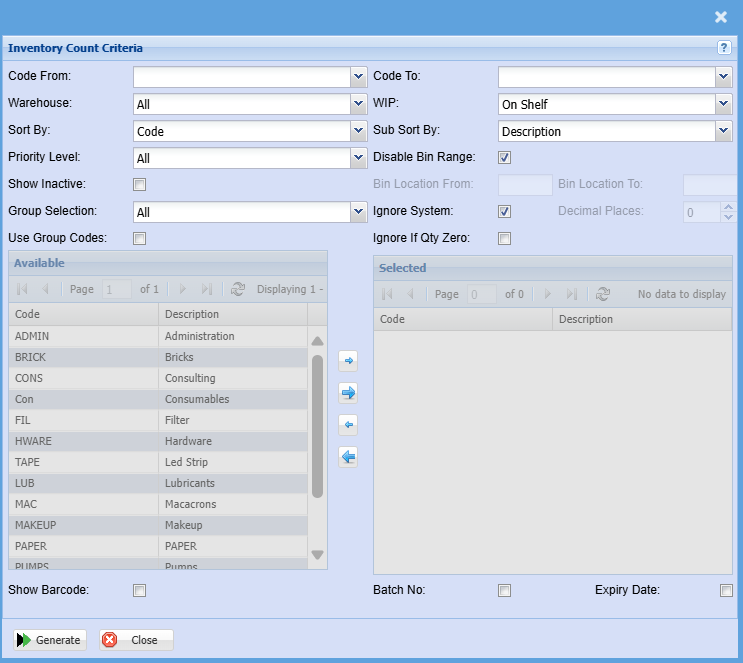
| Code from / Code To |
Select the from item in your list, this looks at the code in order to determine the from and to. |
| Warehouse | If you select all warehouses the report will fetch data from all warehouses. If you want to search by a specific warehouse, select the warehouse from the menu. |
| WIP (Work in progress) |
Run the count for working progress items, On Shelf, All, Invoice, Sales Orders, Jobs and Bill of Materials. Most counts are done on the on-shelf option |
| Sort by | Choose from the drop-down menu how you would like your report sorted, your options are by Description, Code, Description, Group Code or Bin Location. |
| Sub sort by | Sub Sort the report by selecting one option from the drop-down menu allows the user to pull a report with a secondary criteria that will be sorted by either, Code, Description, Warehouse or Bin location. |
| Priority level | Count based on the Priority level of marked items |
| Disable bin range |
Disable bin range is on by default which means the order is by code. Enable this which allows you to print count by bin location from and to |
| Bin location from / To | Select which bin to print from and to |
| Show inactive | Show inactive items on printout (Default option is off) |
| Group selection |
Print a selected group selection of your group codes This is defined in the group code setup which allows you to count for specific groups automatically |
| Ignore system Qty |
This option is on by default to ignore the system quantity on report. if you want the system on hand value, remove the tick |
| Decimal places | It is advisable to set decimals to two places. You can View the report with any number of decimal places. |
| Ignore if quantity zero | Tick this box if you would like to exclude Inventory items with Zero Quantity. |
| Use group codes |
Double click on the code from the list to move the group codes you wish to filter your report by to the selected window. |
| Available group codes | Displays a list of available group codes |
| Selected group codes | Shows the list of selected group codes for the report |
| Show barcode | Show the barcode on the printout |
| Batch number | Display the batch number of the stock item |
| Expiry Date | Display the default expiry date of the item |
Print count with on hand quantity
To print the report with the displayed on-hand quantity, remove the tick for "Ignore system quantity" on the criteria

Report with count, showing on hand quantity
Inventory Forecast Report
Select inventory on the category drop down
Search for Inventory Forecast Report on the list the double click on it to be able to edit it
The report is extensive and checks all sales by item and a forecast is made of the stock required based on the past period specified
Inventory Module> Reports> Reports List
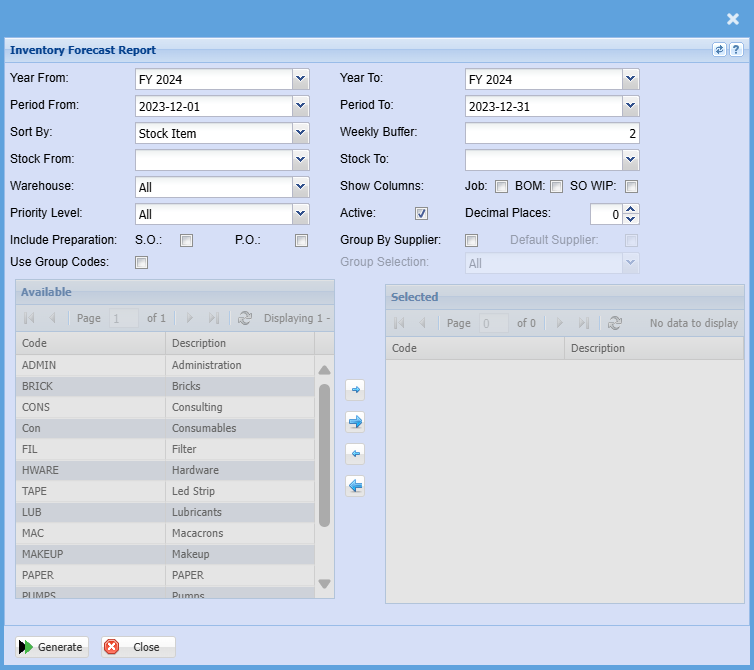
Select from the following fields to run the report:
| Year From / To | Select the year From and Year To Dates from the drop-down menus will show results specific to the period you have selected. |
| Period From / To | Select the period From and the period to from the drop-down menu |
| Sort By | Sort the report by selecting one an option from the drop-down menu |
| Weekly Buffer | |
| Stock From / To |
Select a stock item you wish to search from. If you leave the stock item fields blank, all stock items will be displayed on the report. If you choose specific stock items, the report will sort information by stock item code rather than description. Select the start stock code and the end stock code for the report. |
| Warehouse | If you select all warehouses the report will fetch data from all warehouses. If you want to search by a specific warehouse, select the warehouse from the menu. |
| Show Columns | Tick which columns you would like to show on the report Job / Bom / SO WIP |
| Priority Level | Click on the drop down to and select by priority you wish to see |
| Active Tick | Allows the user to run either active or inactive inventory forecast |
| Decimal Places | It is advisable to set decimals to two places. You can View the report with any number of decimal places. |
| Include Preparation | Tick S.O or P.O |
| Use Group Codes | Double click on the code from the list to move the group codes you wish to filter your report by to the selected window. |
Inventory Group Percentage Profit
Gives a total selling versus costs per group sold and its percentage profit for a specified period.
Inventory module> Reports> Reports List
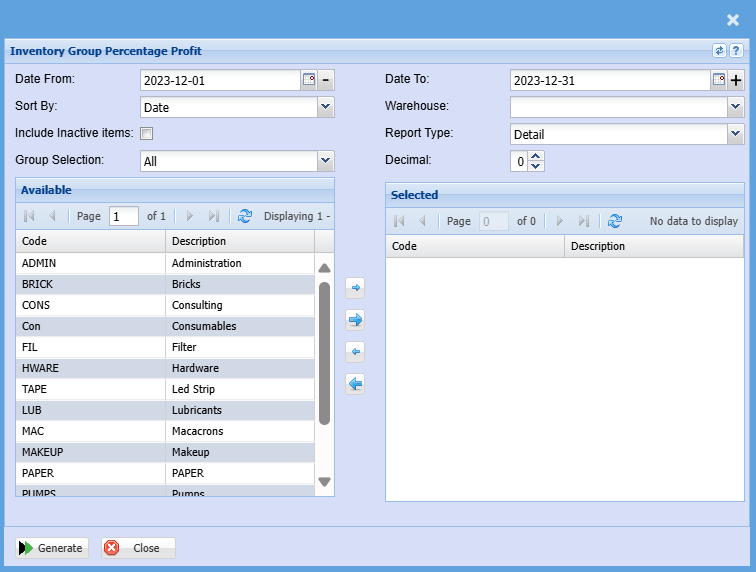
| Date From / To |
Choose the date range for which you want to view the report from. Select a date range of when you want to see the report to. |
| Sort By | Sort the report by selecting one option from the drop-down arrow, choose from Date, Doc No. Debtors Name or the Item Code. |
| Include Inactive Items | Ticking this box will include inactive items on the report when selected |
| Group Selection | Double click on the code from the list to move the group codes you wish to filter your report by to the selected window. |
| Warehouse | If you select all warehouses the report will fetch data from all warehouses. If you want to search by a specific warehouse, select the warehouse from the menu. |
| Report Type | Select the report type from the drop-down arrow |
| Decimal |
It is advisable to set decimals to two places You can view the report with any number of decimal places. |
Inventory Last Used Report
This report gives a list of all inventory items and the last document on which it was used
Inventory module> Reports> Reports List
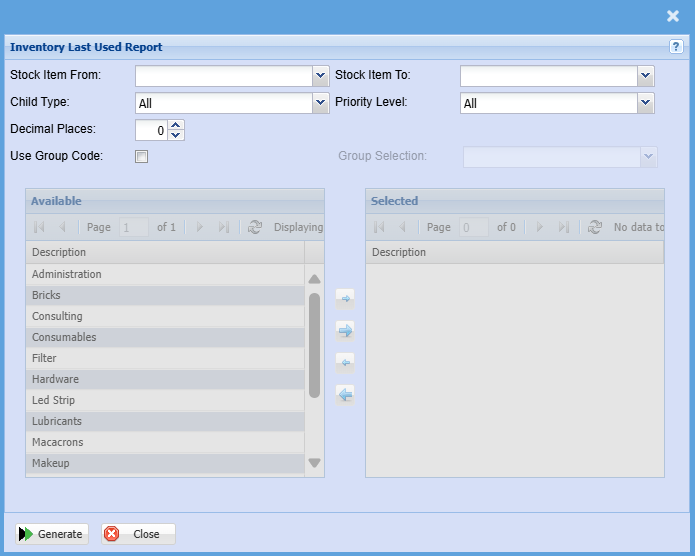
| Stock Item From / Stock Item To |
If you leave the stock item fields blank, all stock items will be displayed on the report. If you choose specific stock items, the report will sort information by stock item code rather than description. Select a stock Item on the drop-down menu. |
| Child Type | Select child type on the drop-down menu selection |
| Decimal Places |
It is advisable to set decimals to two places You can view the report with any number of decimal places. |
| Use Group Code | Double click on the code from the list to move the group codes you wish to filter your report by to the selected window. |
| Priority Level | Select priority level on the drop-down menu selection |
| Group Selection | Select group selection on the drop-down menu |
Inventory Listing Report
Reports on all inventory items which have being added to the inventory Setup. Custom Fields can also be used to sort inventory items for this report.
Inventory module> Reports> Reports List
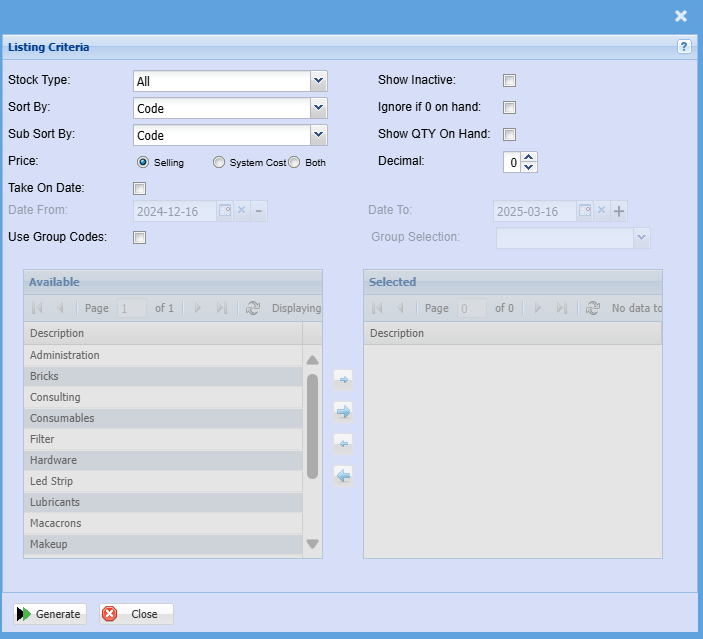
| Stock Type | Select a stock type from the drop-down menu selection, the types would be Custom, Stock service, or you could pull a report for all three. |
| Sort By | Choose from the drop-down menu how you would like your report sorted, your options are by Code, Description or Category. |
| Sub Sort By | Sub Sort the report by selecting one option from the drop-down menu allows the user to pull a report with a secondary criteria that will be sorted by either, Code, Description or Category. |
| Price | Select either the selling or system option for this report |
| Take On Date | Put a tick on if you want to filter the report by take on dates |
| Date From / Date To |
Choose the date range for which you want to view the report from. Select a date range of when you want to see the report to. |
| Use Group Codes | Double click on the code from the list to move the group codes you wish to filter your report by to the selected window. |
| Show Inactive | The report will include inactive items when this option is selected |
| Ignore if 0 on hand | The report will ignore zero quantities when selected |
| Show QTY On Hand | The report will show the quantity on hand if this option is selected |
| Decimal |
It is advisable to set decimals to two places. |
| Group Selection | Select group selection from the drop-down menu |
Inventory Slow Movers
Allows a check on inventory items sold below a certain value indicated by the user.
Inventory module> Reports> Reports List
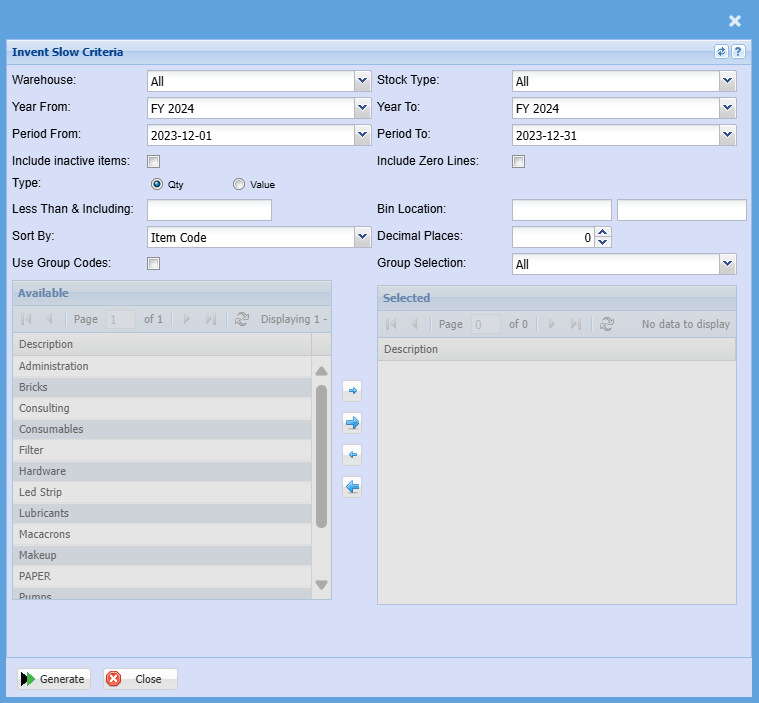
Allows a check on inventory items sold below a certain value indicated by the user
| Warehouse |
If you select all warehouses the report will fetch data from all warehouses If you want to search by a specific report, select the report on the warehouse selection |
| Year From / Year To | Select the year From and Year To Dates from the drop-down menus will show results specific to the period you have selected. |
| Period From / Period To | Select the period From and the Period To from the drop-down menu |
| Include inactive items | This option will include inactive items in the report if selected |
| Type | Select either Quantity or value option for a report |
| Less Than & Including | Enter the number less than and including the entered number |
| Sort By | Sort the report by select one option form the drop-down menu |
| Use Group Codes | Double click on the code from the list to move the group codes you wish to filter your report by to the selected window. |
| Stock Type | To select type of stock or leave it to “All” for the report |
| Include Zero Lines | The option will include zero lines on the report as well if selected for the report |
| Bin Location | |
| Decimal Places |
It is advisable to set decimals to two places You can view the report with any number of decimal places. |
| Group Selection | Select a group selection on the drop-down menu |
| Generate Button |
Click the "Generate" button to open the report You will have options to copy, email, or print the report To view the report in an Excel document, click copy on the report and past it into an Excel file |
Inventory Summary Report
Shows the value or quantity sold per month of inventory items in a table form.
Inventory module> Reports> Reports List

| Year From / Year To | Select the year From and Year To Dates from the drop-down menus will show results specific to the period you have selected. |
| Period From / Period To | Select the period From and the Period To from the drop-down menus |
| Inventory From / Inventory To | If you leave the stock item fields blank, all stock items will be displayed on the report. If you choose specific stock items, the report will sort information by stock item code from and to the selected codes rather than description. |
| Use Group Codes | Double click on the code from the list to move the group codes you wish to filter your report by to the selected window. |
| Group Selection | Double click on the code from the list to move the group codes you wish to filter your report by to the selected window. |
| Type | Type allows you to refine your report to only show Item Quantity of sales, Sales Value, Cost of Sales or Quantity and Sales together. |
| Stock Type | Select from All, Stock, Service or Custom from the drop-down menu if you want to refine your Inventory report. |
| Branch | When working with multiple branches this drop-down allows the user to select a specific branch to pull a report for. |
| Generate Button |
Click the "Generate" button to open the report You will have options to copy, email, or print the report To view the report in an Excel document, copy the report and paste it into an Excel file |
| Export | This allows you to export your report to an excel spreadsheet |
Inventory Transactions
Gives a total movement per inventory item by quantity or value for a specified date range.
Inventory module> Reports> Reports List
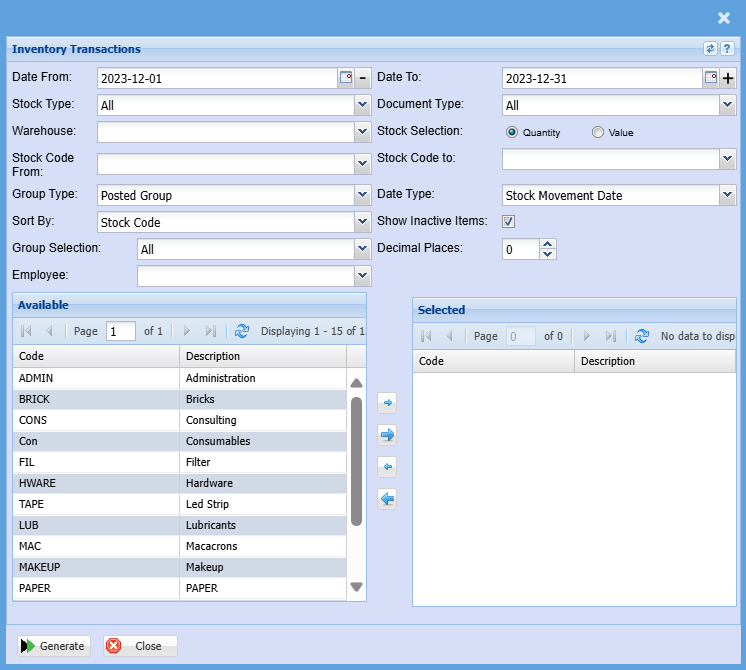
To generate the report, please select from the following fields:
| Date From / Date To |
Choose the date range for which you want to view the report from Select a date range of when you want to see the report to |
| Stock Type |
Allows you to select a stock type from the drop-down Menu |
| Warehouse |
If you select all warehouses the report will fetch data from all warehouses. |
| Stock Code From / Stock Code To |
If you leave the stock item fields blank, all stock items will be displayed on the report. If you choose specific stock items, the report will sort information by stock item code rather than description. Select a stock Item on the drop-down menu. |
| Group Type |
Select the group type from the drop-down menu. |
| Sort By |
Sort the report by selecting one option from the drop-down menu |
| Group Selection |
Double click on the code from the list to move the group codes you wish to filter your report by to the selected window. |
| Employee |
Select an employee you wish to filter the report by on the drop-down menu |
| Document Type |
Select the document type from the drop-down menu |
| Stock Selection |
Select either a quality or value option for the report |
| Date Type |
Select a date type on the drop-down menu |
| Show Inactive Items |
This option will show inactive items on the report if selected |
| Decimal Places |
It is advisable to set decimals to two places You can view the report with any number of decimal places. |
| Generate Button |
Click the "Generate" button to open the report You will have options to copy, email, or print the report To view the report in an Excel document, click copy on the report and past it into an Excel file |
Inventory Valuation
Gives a report of all items cost, multiplied by quantity, to give the total value of stock. This can be given by warehouse, group codes and by various Work in Progress areas.
Inventory module> Reports> Reports List
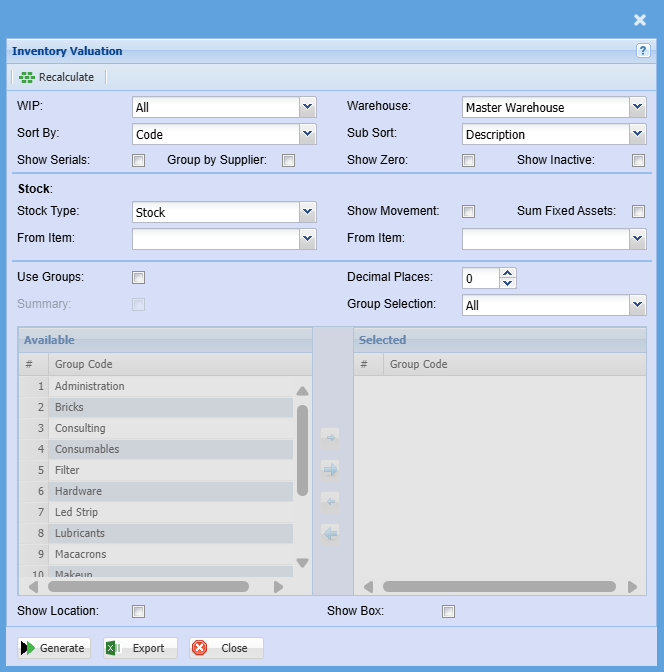
| Work In Progress (WIP) |
Select a work in progress document on the drop-down menu selection. If you leave it on ALL report will display all work in progress documents. |
| Sort By | Sort the report by selecting one option from the drop-down menu allows the user to pull a report that will be sorted by either, Code, Description, Warehouse or Bin location. |
| Show Serials | Put a tick on to show serial numbers on the report. |
| Warehouse |
If you select all warehouses the report will fetch data from all warehouses. If you want to search by a specific warehouse, select the warehouse from the menu. |
| Sub Sort |
Sub Sort the report by selecting one option from the drop-down menu allows the user to pull a report with a secondary criteria that will be sorted by either, Code, Description, Warehouse or Bin location. |
| Show Zero | Put a tick on to show zero quantities |
| Show Inactive | Put a tick on to show inactive items |
| Stock Type | Select the stock type you wish to filter the report by |
| From Item / To Item | From Item and to Item allows the user to select a stock item from where the report will start and the end. |
| Show Movement | Put a tick on to show movement |
| Sum Fixed Assets | Put a tick on to sum fixed assets |
| Use Groups | Put a tick on to be able to use group codes |
| Summary | When selecting this option, the report will only show the group code on hand and total |
| Decimal Places |
It is advisable to set decimals to two places You can view the report with any number of decimal places |
| Group Selection | Select a group selection on the drop down and move the group codes you wish to filter your report by to the selected window |
| Generate Button |
Click the "Generate" button to open the report You will have options to copy, email, or print the report To view the report in an Excel document, copy the report and paste it into an Excel file |
Inventory Valuation Summary
Gives a report similar to the inventory valuation report except it gives it by group and then broken down into individual items
Inventory module> Reports> Reports List
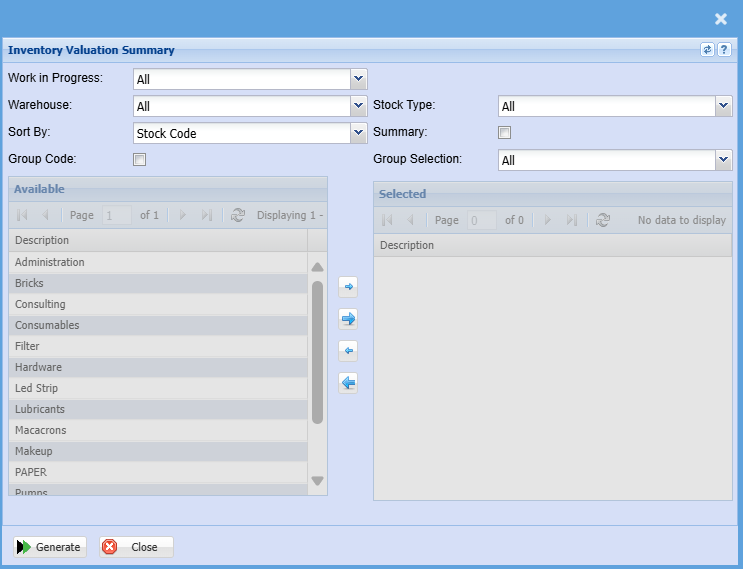
To run the report, select work in progress, warehouse, stock type and sort by options from the drop-down arrows.
| Work in Progress (WIP) |
Run the count for working still currently progress items, On Shelf, All, Invoice, Sales Orders, Jobs and Bill of Materials. Most counts are done on the on-shelf option. |
| Warehouse |
If you select all warehouses the report will fetch data from all warehouses. If you want to search by a specific report, select the report on the warehouse selection |
| Sort By |
Sort the report by selecting one option from the drop-down menu allows the user to pull a report that will be sorted by either, Code, Description, Warehouse or Bin location. |
| Group Code | Double click on the code from the list to move the group codes you wish to filter your report by to the selected window. |
| Stock Type |
Select from All, Stock, Service or Custom from the drop-down menu if you want to refine your Inventory report. |
| Summary | When selecting this option, the report will only show the group code on hand and total |
| Group Selection |
Double clock on the code from the list to move the group codes you wish to filter your report by to the selected window |
| Generate Button |
Click the "Generate" button to open the report You will have options to copy, email, or print the report To view the report in an Excel document, copy the report and paste it into an Excel file |
Inventory WIP Breakdown
This report shows all inventory stock type items of total movement taken place in warehouses vs warehouse instance as well as movement in Work in Progress areas. Checks that stock balance movements are correct.
Inventory module> Reports> Reports List
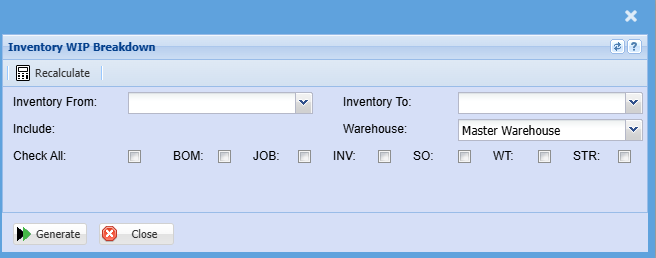
To run the report, select the inventory as the start item and inventory to as the end item. The
report will run according to the selection made
| Inventory From |
If you leave the stock item fields blank, all stock items will be displayed on the report. If you choose specific stock items, the report will sort information by stock item code from and to the selected codes rather than description. |
| Include | This allows the user to choose which workflows they want to include in their report. |
| Check All | This allows the user to select some or all of the options that will be included on the report |
| Warehouse |
If you select all warehouses the report will fetch data from all warehouses If you want to search by a specific report, select the report on the warehouse selection |
| Generate Button |
Click the "Generate" button to open the report You will have options to copy, email, or print the report To view the report in an Excel document, copy the report and paste it into an Excel file |
Margin Percentage Exception Report
List of Inventory Items showing the Supplier's cost and the GRV cost. The report can be filtered by exceptions where the Supplier's cost differs from the GRV cost and sorted either by Supplier or by Date.
Inventory module> Reports> Reports List
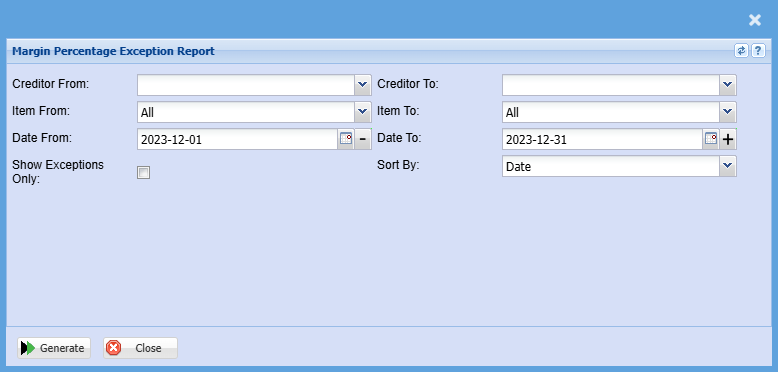
| Supplier From / Supplier To |
If you leave Creditor/Supplier From and To fields blank, all supplier/creditor margin percentage exception report will be displayed on the report. If you choose a specific creditor/ supplier, the report will sort information by creditor/supplier code and not creditor/ supplier name |
| Item From / Item To |
If you leave the stock item fields blank, all stock items will be displayed on the report. If you choose specific stock items, the report will sort information by stock item code from and to the selected codes rather than description. |
| Date From / Date To |
Choose the date range for which you want to view the report from. Select a date range of when you want to see the report to. |
| Show Exceptions Only |
Put a tick on if you want to show exceptions only |
| Sort By |
Sort the report by selecting one option from the drop-down menu |
| Generate Button |
Click the "Generate" button to open the report You will have options to copy, email, or print the report To view the report in an Excel document, copy the report and paste it into an Excel file |
BOM Recipe List Report
List of BOM items from BOM Activity menu
Inventory> Reports> Report List
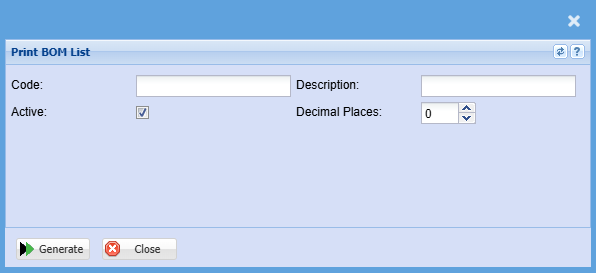
| Code | Search for a report by adding a BOM code |
| Active |
Put a tick to search for all active bill of materials Dont put a tick on if you want to view all deactivated bill of materials |
| Description | Filter a report by bill of material description |
| Decimal Places |
It is advisable to set decimals to two places You can view the report with any number of decimal places. |
| Generate Button |
Click the "Generate" button to open the report You will have options to copy, email, or print the report To view the report in an Excel document, copy the report and paste it into an Excel file |
Sales Order Stock Items
Inventory module> Reports> Reports List
Report on stock items on Shelf and Sales Orders

| Stock From / Stock To |
If you leave the stock item fields blank, all stock items will be displayed on the report. If you choose specific stock items, the report will sort information by stock item code from and to the selected codes rather than description. |
| Warehouse |
If you select all warehouses the report will fetch data from all warehouses If you want to search by a specific report, select the report on the warehouse selection |
| Include Zero | Put a tick on to include all items with zero |
| Sales Order Status | Select the Sales order status you want to filter your report by on the drop-down menu selection |
| Generate Button |
Click the "Generate" button to open the report You will have options to copy, email, or print the report To view the report in an Excel document, copy the report and paste it into an Excel file |
Stock Control Report
This report shows stock values per warehouse and WIP
Inventory module> Reports> Reports List
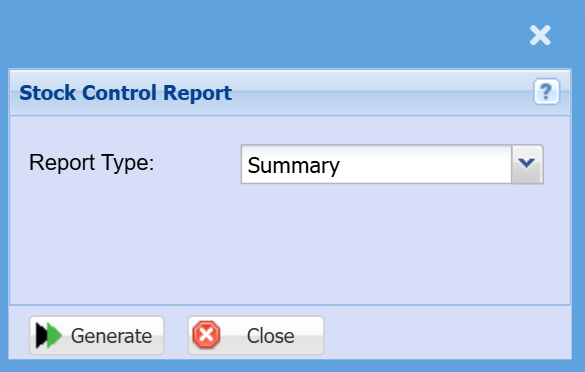
| Summary | If you leave the selection on summary this will report will only show a summary of the stock control report |
| Detail | This will break down all the details of the report for you |
| Generate Button |
Click the "Generate" button to open the report You will have options to copy, email, or print the report To view the report in an Excel document, copy the report and paste it into an Excel file |
Stock Count Sales Analysis
Inventory module> Reports> Reports List

| Customer |
Select a customer you wish to filter the report by on the drop-down menu. If the customer/ debtor doesn't have any stock count under their name for the selected count date the generate and export for quote buttons will be greyed out |
| Sales Rep | If you want to run a report by a specific sales rep, then you will need to select the sales rep on the drop-down menu. If you leave the sales rep on all the report will run by all sales rep. |
| Count Date | Select the count date you would like to pull the report for |
| Last Count Date | Select the last count date |
| Copy Last Count Date | Copy last count date automatically fills the last stock count date for the selected customer/ debtor |
| Group By | The report can be grouped by selecting one option from the drop-down menu |
| Group Selection | Select a group selection on the drop down and move group codes you wish to filter your report by to selected window |
| Generate |
Click the "Generate" button to open the report You will have options to copy, email, or print the report To view the report in an Excel document, copy the report and paste it into an Excel file |
| Export for Quote | Export for quote allows you to export the stock count to excel and to import as a quote without having to make any edits to the document |
Stock Location and Weight
Inventory module> Reports> Reports List
Gives the bin location with weight, unit of measure and quantity on hand for each item in a list.
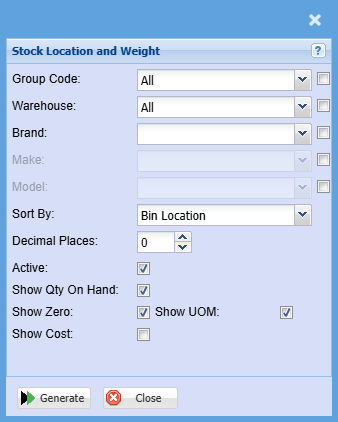
| Group Code | If you have set up Group Codes for your inventory you can select a group code from the drop-down menu to define your search to a specific group. |
| Warehouse |
If you select all warehouses the report will fetch data from all warehouses If you want to search by a specific report, select the report on the warehouse selection |
| Brand | When working with multiple branches this drop-down allows the user to select a specific branch to pull a report for. |
| Make | Select the Make from the drop-down menu to refine your search for your report. |
| Model | Select the Model from the drop-down menu to refine your search for your report. |
| Sort By | Sort the report by selecting one option from the drop-down menu allows the user to pull a report that will be sorted by either, Code, Description, Warehouse or Bin location. |
| Decimal Places |
It is advisable to set decimals to two places You can view the report with any number of decimal places. |
| Active | this option will show active stock locations and weight only if selected |
| Show Qty On Hand | this option as well will show the quantity on hand only when selected |
| Show Zero | By ticking this box, a column will be added to show items with zero quantities |
| Show Cost | By ticking this box, a column will be added to show the cost of each inventory item |
| Show UOM | By ticking this box, a column will be added to show the unit of measure for each inventory item |
| Generate Button |
Click the "Generate" button to open the report You will have options to copy, email, or print the report To view the report in an Excel document, copy the report and paste it into an Excel file |
Stock Movement Per Month
Inventory> Reports> Report List
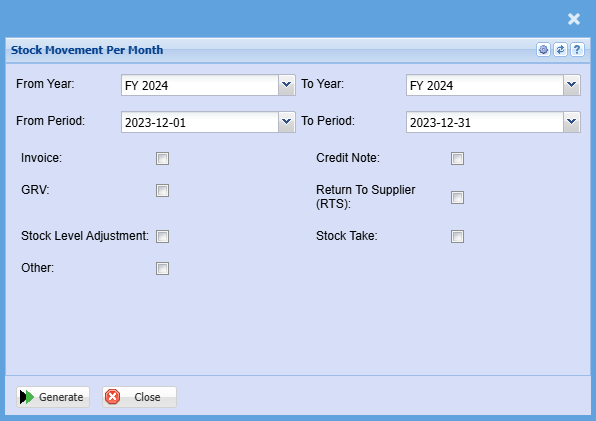
| From Year / To Year | Select the year From and Year To Dates from the drop-down menus will show results specific to the period you have selected. |
| From Period / To Period | Select the period From and The Period To from the drop-down menus |
| Invoice | Put a tick if you would like to view the value of invoices for a period you have selected |
| GRV | Put a tick if you would like to view the value of Goods received vouchers -GRV for a period you have selected |
| Stock Level Adjustment | Put a tick if you would like to view the value of stock level adjustments for a period you have selected |
| Other | Put a tick if you would like to view the value of other transactions for a period you have selected |
| Credit Note | Put a tick if you would like to view the value of credit notes for a period you have selected |
| Return to Supplier (RTS) | Put a tick if you would like to view the value of return to the supplier (RTS) for a period you have selected |
| Stock Take | Put a tick if you would like to view the value of stock takes for a period you have selected |
Stock Purchasing Forcast By Brands Report
Inventory> Reports> Report List
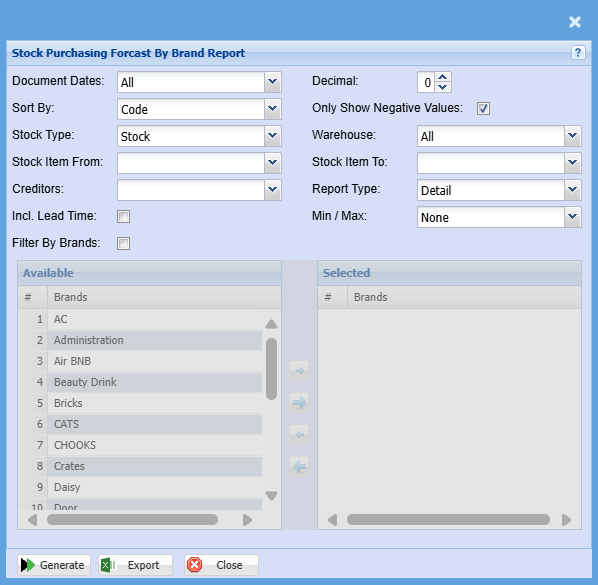
| Document Dates |
Select document days on the drop-down menu if you are wanting to pull this report for a specific date. Leave document selection on all if you want the report to show all document dates |
| Sort By | Sort the report by selecting one option from the drop-down menu allows the user to pull a report that will be sorted by either, Code, Description, Warehouse or Bin location. |
| Stock Type | Select from All, Stock, Service or Custom from the drop-down menu if you want to refine your Inventory report. |
| Stock Item From / Stock Item To |
If you leave the stock item fields blank, all stock items will be displayed on the report If you choose specific stock items, the report will sort information by stock item code rather than description |
| Creditors |
Filter report by the supplier if you want to pull report by a specific supplier Leave this section black if you want to pull the report on all customers |
| Incl. Lead Time | Put a tick on if you wish to include lead time on the report |
| Filter By Brands |
Double click on the Brand from the list to move the group codes you wish to filter your report by to the selected window. |
| Decimal |
It is advisable to set decimals to two places You can view the report with any number of decimal places. |
| Only Show Negative Values | Put a tick on if you only want to show negative values on the report |
| Warehouse |
Select the warehouse from the drop-down arrow If you leave the warehouse on all the report will pull on all warehouses |
| Report Type |
Report Type allows the user to select either detail or summary from the drop-down arrow. |
| Min / Max | Select Min/Max from the drop-down menu for which you want to run your report by or leave it on none if you do not wish to see the report by min/max |
| Generate Button |
Click the "Generate" button to open the report You will have options to copy, email, or print the report To view the report in an Excel document, copy the report and paste it into an Excel file |
| Export Button |
This allows you to export the report to an Excel file |
Stock Purchasing Forecast Report
Inventory> Reports> Report List
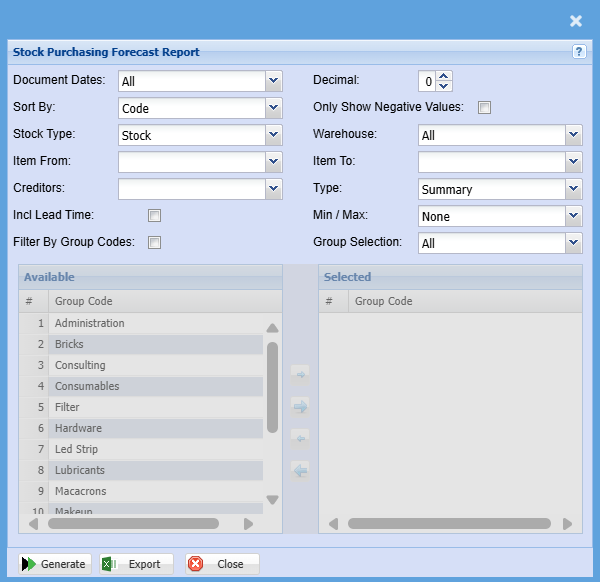
| Document Dates |
Select document days on the drop-down menu Leave document selection on all if you want the report to show all document dates |
| Sort By | Sort the report by selecting one option from the drop-down menu |
| Stock Type | Select stock type on the drop-down menu |
| Item From |
If you leave the stock item fields blank, all stock items will be displayed on the report If you choose specific stock items, the report will sort information by stock item code rather than description |
| Supplier |
Filter report by the supplier if you want to pull report by a specific supplier Leave this section black if you want to pull the report on all customers |
| Incl Lead Time | Put a tick on if you wish to include lead time on the report |
| Filter By Group Codes | Put a tick on if you want to filter the report by group code |
| Decimal |
It is advisable to set decimals to two places You can view the report with any number of decimal places. |
| Only Show Negative Values | Put a tick on if you only want to show negative values on the report |
| Warehouse |
If you select all warehouses the report will fetch data from all warehouses. If you want to search by a specific warehouse, select the warehouse from the menu. |
| Item To | Select the stock item to |
| Type |
Type allows you to refine your report to only show Item Quantity of sales, Sales Value, Cost of Sales or Quantity and Sales together. |
| Min / Max | Select Min/Max on you want to run your report by or leave it on none if you do not wish to filter the report by min/max |
| Group Selection | Select a group selection on the drop down |
| Generate Button |
Click the "Generate" button to open the report You will have options to copy, email, or print the report To view the report in an Excel document, copy the report and paste it into an Excel file |
| Export Button |
This allows you to export the report to an Excel file |
Stock Request Report
Gives a report on all stock request completed in various statuses
Inventory module> Reports> Reports List
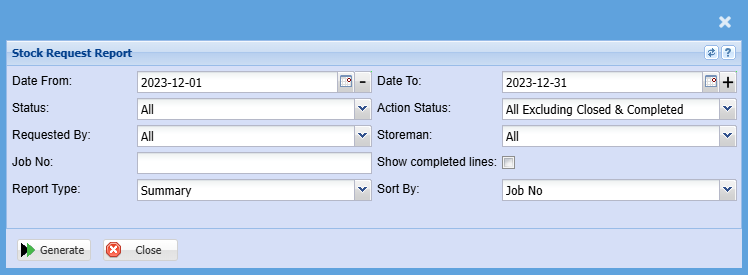
| Date From / Date To |
Choose the date range for which you want to view the report from Select a date range of when you want to see the report to |
| Status |
If you select all the report will pull all statuses If you want to view the report by status, select the status on the drop-down menu |
| Requested By | Select one option from the drop-down menu |
| Job No | Select one option from the drop-down menu |
| Report Type | Select the type of the report from the drop-down menu |
| Action Status | Select action status on the drop-down menu |
| Storman |
Select a Storman from the drop-down menu If you want the report to show all Storman click on all |
| Show completed lines | Put a tick on to show all completed lines on the report |
| Sort By | sort the report by selecting one from the drop-down menu |
Supplier Inventory Quantity
This report shows all stock items group by suppliers showing various quantities
Inventory module> Reports> Reports List
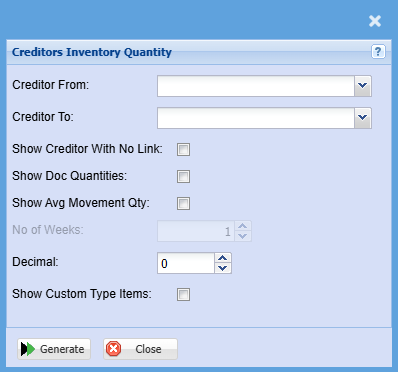
| Supplier From / Suppliers To |
Select a supplier you want to view a margin percentage exception report for. If you leave creditor/supplier from fields blank, all supplier/creditor margin percentage exception report will be displayed on the report. If you choose a specific creditor/ supplier, the report will sort information by creditor/supplier code and not creditor/ supplier name. You can also choose a range by adding a Supplier To.
|
| Show Supplier with No Link | Put a tick on to show supplier with no link on the report |
| Show Doc Quantities | Put a tick on doc quantities on the report |
| Show Avg Movement Qty | Put a tick on to show average movement quantity on the report |
| No of Weeks | |
| Decimal |
It is advisable to set decimals to two places You can view the report with any number of decimal places. |
| Show Custom Type Items | Put a tick on to show customer type items on the report |
| Generate Button |
Click the "Generate" button to open the report You will have options to copy, email, or print the report To view the report in an Excel document, copy the report and paste it into an Excel file |
Supplier Price Listing
Shows each item with its supplier code, last update and supplier cost in a list.
Inventory module> Reports> Reports List
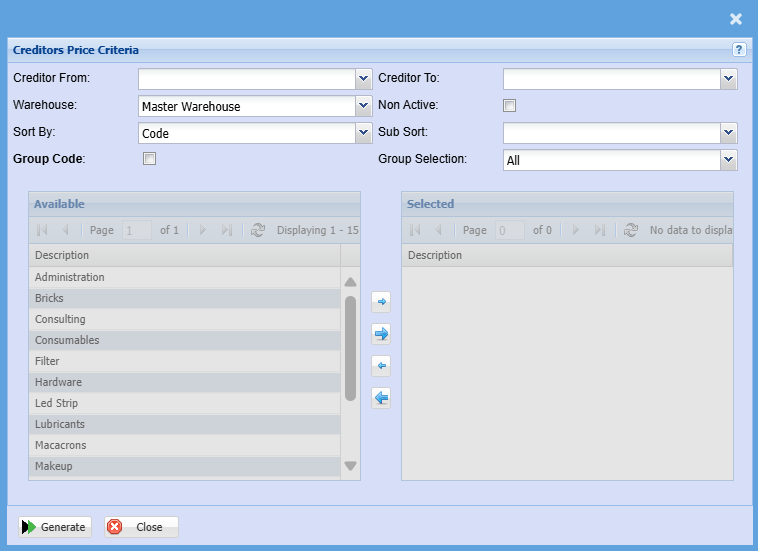
| Creditor From / Creditors To |
Select a Customer/Debtor you wish to view the report from. Select the Customer/Debtor you wish to see up to in the report. |
| Warehouse |
If you select all warehouses the report will fetch data from all warehouses. If you want to search by a specific warehouse, select the warehouse from the menu. |
| Sort By |
Sort the report by selecting one option from the drop-down menu |
| Group Code | If you have set up Group Codes for your inventory you can select a group code from the drop-down menu to define your search to a specific group. |
| Non Active |
Tick this box if you want a report to reflect only the non-active Customers/Debtors |
| Sub Sort | Sub Sort the report by selecting one option from the drop-down menu allows the user to pull a report with a secondary criteria that will be sorted by either, Code, Description, Warehouse or Bin location. |
| Group Selection | Select a group selection on the drop down |
Valuation of Fixed Assets
Gives a report on the list of inventory fixed asset type items value.
Inventory module> Reports> Reports List
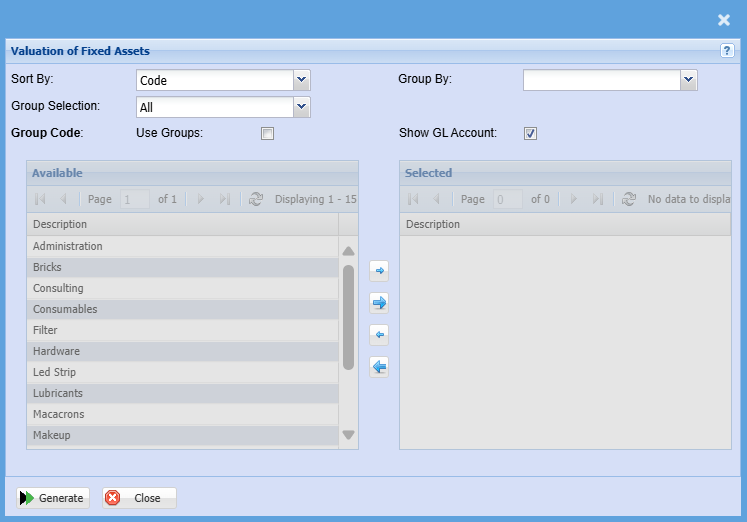
| Sort By | Sort the report by selecting one option from the drop-down menu allows the user to pull a report that will be sorted by either, Code, Description, Warehouse or Bin location. |
| Group Selection | Select a group selection on the drop down |
| Use Groups | Put a tick on if you want to pull a report by groups |
| Group Code | If you have set up Group Codes for your inventory you can select a group code from the drop-down menu to define your search to a specific group. |
| Group By |
Select a group the category you want to group by on the drop-down menu selection Group the report by Code, Description or Leger |
| Show GL Account |
Put a tick on if you want the GL code to display on the report |
| Generate Button |
Click the "Generate" button to open the report You will have options to copy, email, or print the report To view the report in an Excel document, copy the report and paste it into an Excel file |
Valuation of Fixed Assets Version 2
Gives a report of list of inventory fixed asset type item value Version 2
Inventory module> Reports> Reports List
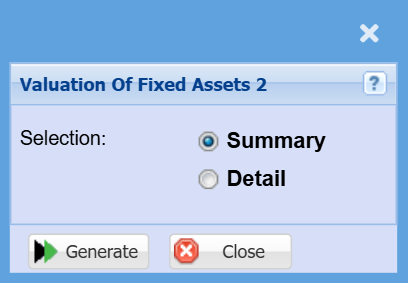
| Summary | If you leave the selection on summary this will report will only show a list of all inventory fixed assets |
| Detail | Details will break down all fixed assets for you |
| Generate Button |
Click the "Generate" button to open the report You will have options to copy, email, or print the report To view the report in an Excel document, copy the report and paste it into an Excel file |
Warehouse Levels
Inventory module> Reports> Reports List
Allows a selection of minimum, maximum, and reorder level quantities in the inventory warehouse setup. Gives the quantity needed at different levels.
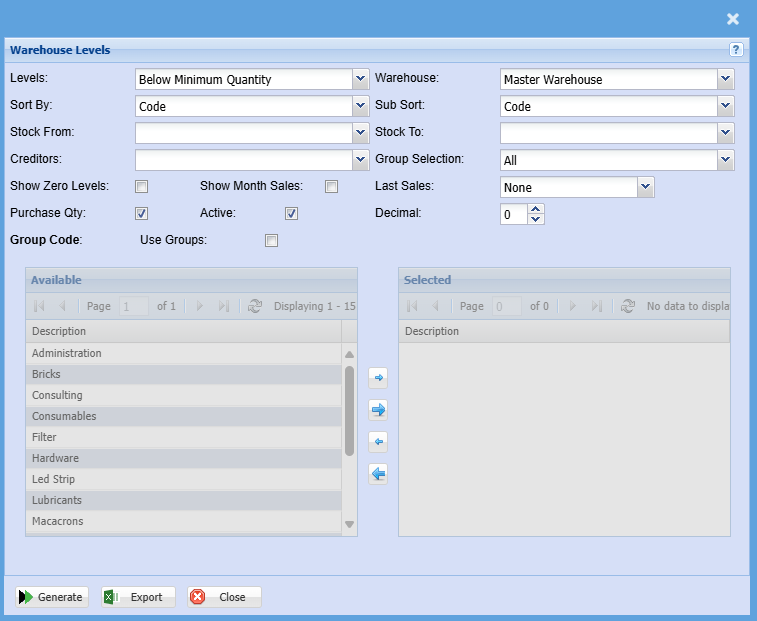
To generate the report, select options from the following fields below.
| Levels | Select the Inventory level option from the drop-down menu that describes the report you are after. |
| Sort By | Sort the report by selecting one option from the drop-down menu allows the user to pull a report that will be sorted by either, Code, Description or Supplier. |
| Stock From / Stock To |
If you leave the stock item fields blank, all stock items will be displayed on the report. If you choose specific stock items, the report will sort information by stock item code from and to the selected codes rather than description. |
| Supplier |
Filter report by the supplier if you want to pull report by a specific supplier Leave this section black if you want to pull the report on all customers |
| Show Zero Levels |
If you put the tick on, it will display all levels including levels with zero quantity If you don't the tick on the report will exclude all items with zero |
| Purchase Qty | Put a tick on if you want the report to display the purchase qty |
| Show Month Sales | Put a tick on if you want your report to display month sales |
| Active | This will pull out active warehouse levels only for this report when selected |
| Last Sales |
If you want to see all warehouse levels, click leave selection to none Select a last sale from the drop down if you want to search by specific last sales |
| Decimal |
It is advisable to set decimals to two places You can view the report with any number of decimal places. |
| Warehouse | If you select all warehouses the report will fetch data from all warehouses. If you want to search by a specific warehouse, select the warehouse from the menu. |
| Sub Sort | Sub Sort the report by selecting one option from the drop-down menu allows the user to pull a report with a secondary criteria that will be sorted by either, Code, Description or Supplier. |
| Use Groups | Put a tick on if you want to pull a report by groups |
| Groups Selection |
Select a group selection on the drop down and move group codes you wish to filter your report by to selected window |
| Generate Button |
Click the "Generate" button to open the report You will have options to copy, email, or print the report To view the report in an Excel document, copy the report and paste it into an Excel file |
| Export Button | This allows you to export the report to Excel |
Warehouse Transfer Detail
Report on warehouse transfer details.
To generate the report, select these fields to indicate the beginning and the end of the report. Date from and date to, transfer number from and transfer number to, stock from and stock to.
Inventory module> Reports> Reports List
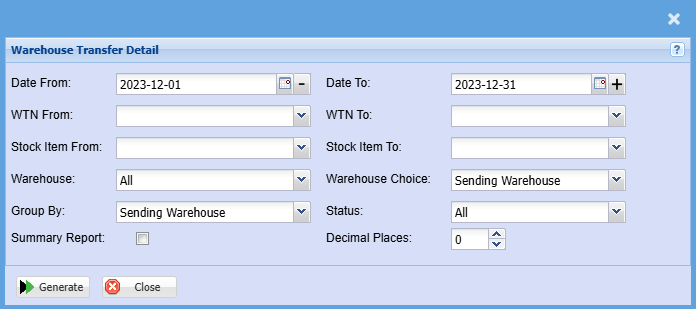
| Date From / Date To |
Choose the date range for which you want to view the report from Select a date range of when you want to see the report to |
| WTN From |
You can search for a warehouse transfer by making use of a warehouse transfer number Select the warehouse transfer number from If you leave this field blank, all warehouse transfer numbers will be recalled based on the selected date range |
| Stock Item From / Stock Item To |
If you leave the stock item fields blank, all stock items will be displayed on the report. If you choose specific stock items, the report will sort information by stock item code from and to the selected codes rather than description. |
| Warehouse |
If you select all warehouses the report will fetch data from all warehouses. If you want to search by a specific warehouse, select the warehouse from the menu. |
| Group By | Select a group you want to search by from the drop-down menu |
| Summary Report | Put a tick on if you only want to see the summary of this report |
| WTN To |
You can search for a warehouse transfer by making use of a warehouse transfer number Select the warehouse transfer number to If you leave this blank this will recall all warehouse transfer numbers based on the date selection If you select the warehouse transfer number from and not add anything on the warehouse to it will populate the warehouse transfer from You need to select the warehouse transfer number to if you want to view a specific list of warehouse transfer numbers |
| Warehouse Choice | Select either sending warehouse or receiving warehouse for the report |
| Status |
If you select all the report will pull all statuses If you want to view report by status, select the status on the drop-down menu |
| Decimal Places |
It is advisable to set decimals to two places You can view the report with any number of decimal places. |
| Generate Button |
Click the "Generate" button to open the report You will have options to copy, email, or print the report To view the report in an Excel document, copy the report and paste it into an Excel file |
Inventory Item Price Report
Inventory item price report combines one item to another.
Primary item and secondary item, the secondary item can be a carton.
Final report will look like this:
A= Primary stock item
B= Secondary stock item
C= Secondary stock item bulk discount
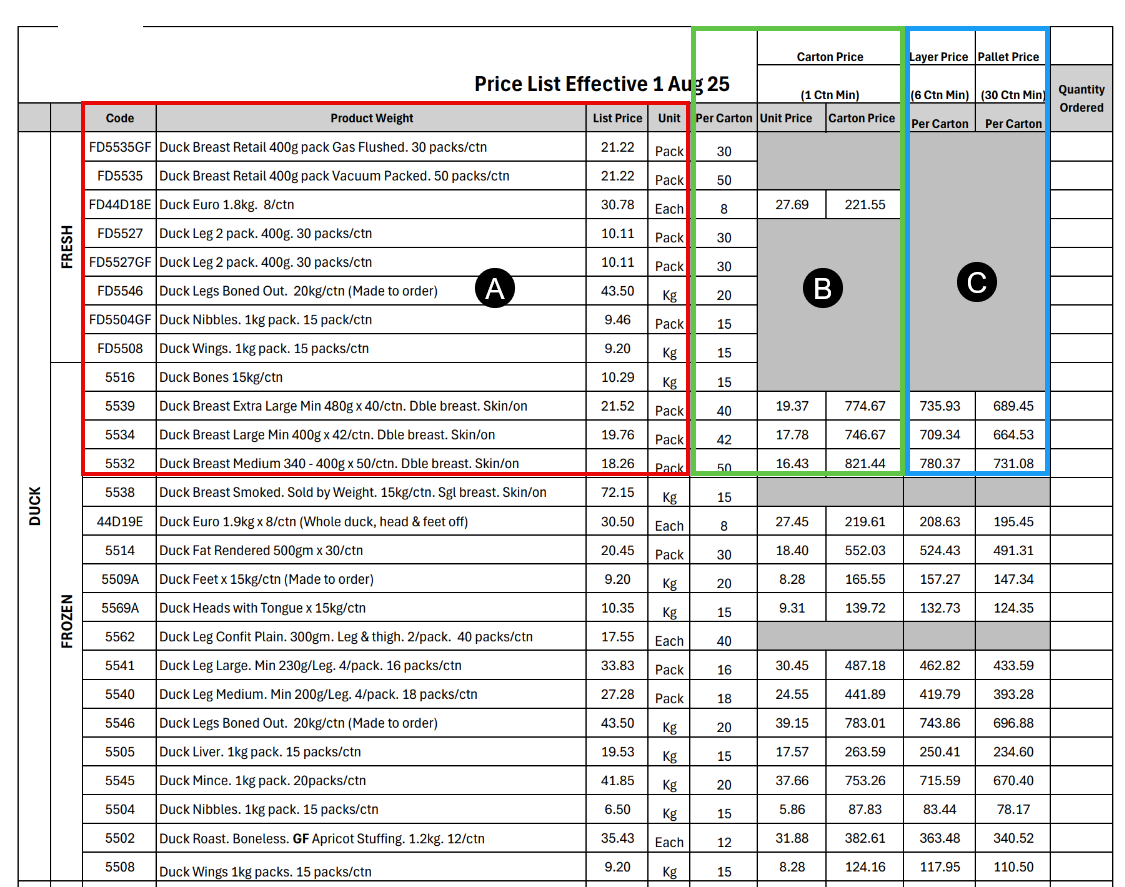
To setup the report, items need to be configured
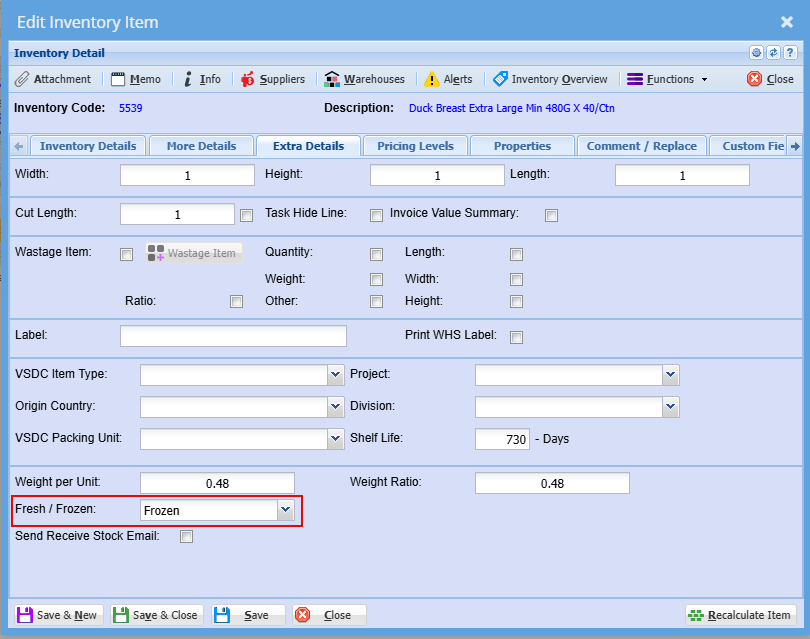
Setting up the primary item:
- Frozen or Fresh
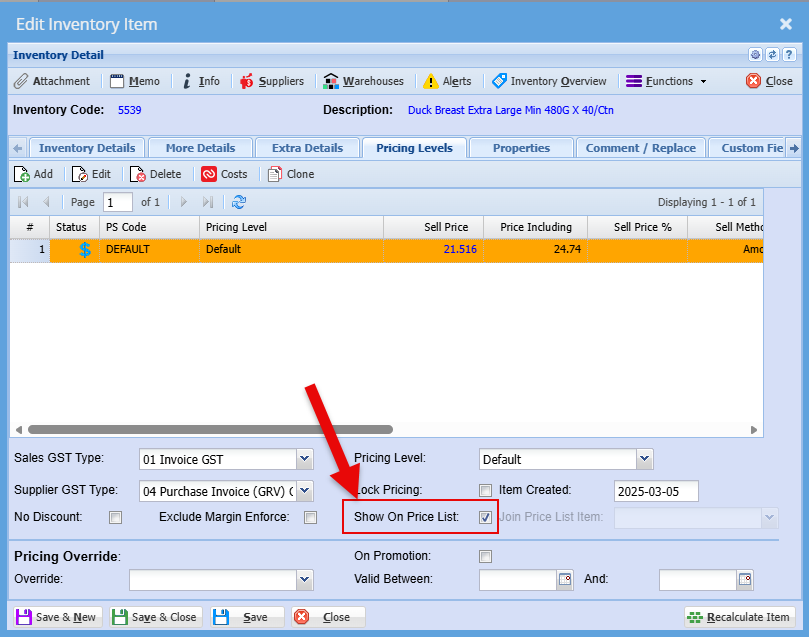
- Tick the Show on Price List
Put the tick on for Show on Price List
Secondary item setup