# Sales Leads Search
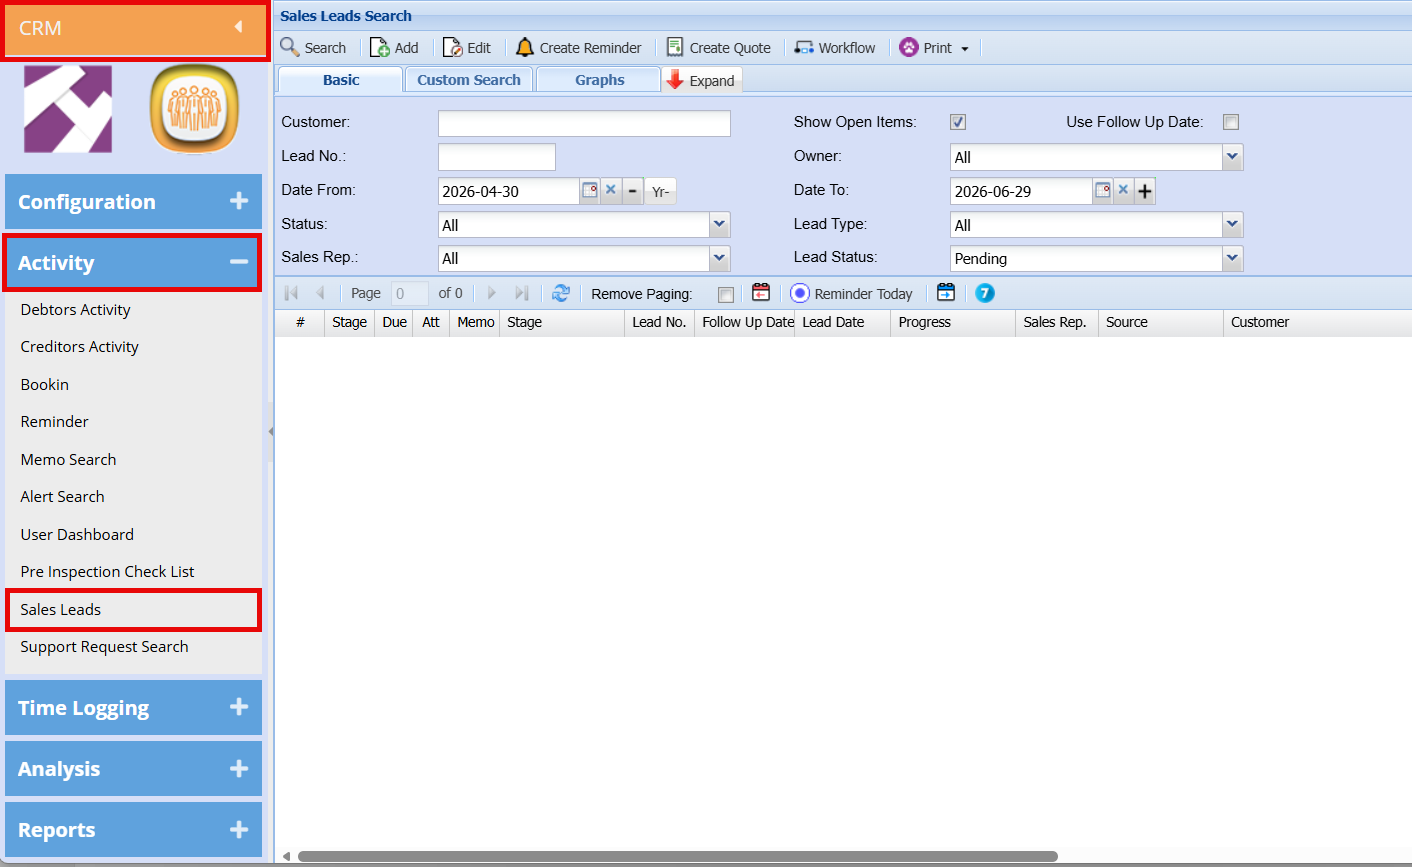
The **Sales Leads** screen allows users to create new Sales Leads or search for existing ones.
Video training manual 2016 - [Click Here](https://vimeo.com/357006299)
** Webatar > Activity> Sales Leads**
[](https://hugeerp10.co.za/hsofmanual/uploads/images/gallery/2026-06/rRHimage.png)
#### Search Functionality
The search panel enables users to filter and locate Sales Leads using criteria such as Customer, Lead Number, Date Range, Status, Sales Representative, Owner, and Lead Type.
- Select the desired filters and click **Search** to refine results.
- If no filters are applied, all Sales Leads will be displayed in the grid.
| **Customer Field** | Searches on the Debtors Code, Debtors Name, email address, telephone number and mobile number fields |
Use the **Expand** button to show additional search filters, or **Contract** to hide them.
##### Action Buttons
Located on the top navigation ribbon:
| **Search** | Runs the search based on selected filters.
|
| **Add** | Creates a new Sales Lead. |
| **Edit** | Opens the selected Sales Lead for editing. |
| **Create Reminder**
| Sets a reminder linked to a Sales Lead. |
| **Create Quote** | Generates a quote from the selected Sales Lead. |
| **Workflow** | Access workflow-related actions. |
| **Print** | Opens print and export options. |
##### Print / Export Options
The **Print** dropdown provides the following:
| **Export** | Export Sales Leads to an Excel file. |
| **Print Grid**
| Print all Sales Leads currently displayed in the grid. |
| **Print Lead Details** | Print details of the selected Sales Lead. |
| **Print Lead Form** | rint a blank Sales Lead form template. |
##### Results Grid
The lower section of the screen displays the results grid, showing all matching Sales Leads with key details such as:
- Stage
- Due Date
- Lead Number
- Follow-Up Date
- Lead Date
- Progress
- Sales Representative
- Source
- Customer
### Graph tab
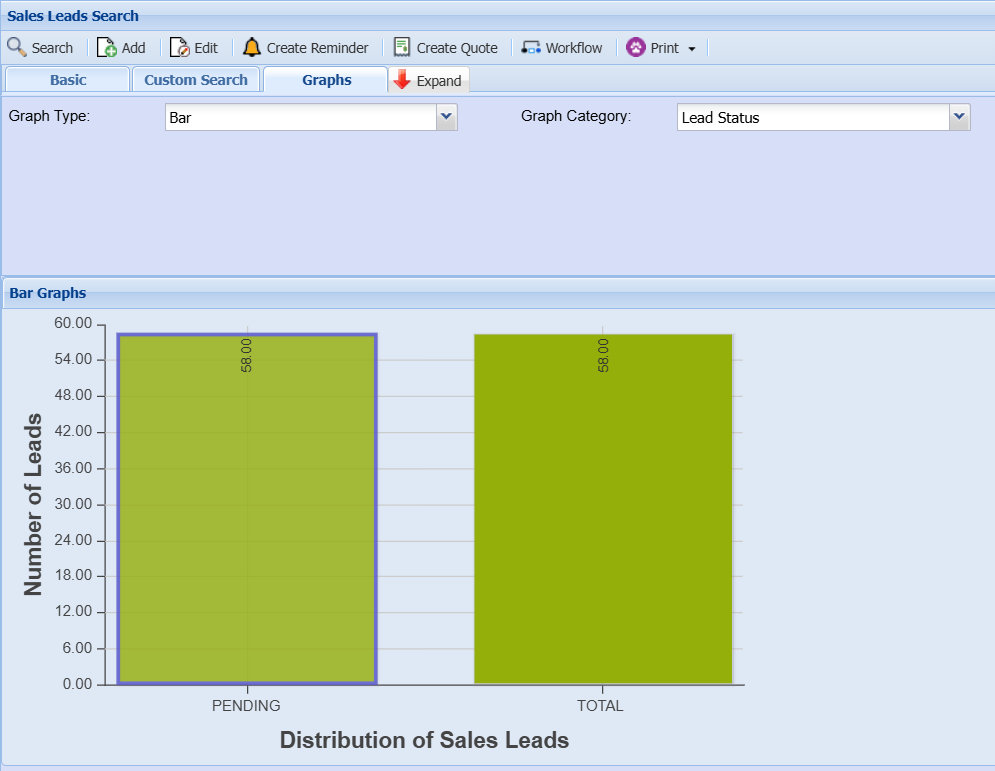
The **Graphs** tab provides a visual overview of Sales Lead data, allowing users to quickly analyse trends and distributions.
- Change any filter and refresh to update the graph dynamically.
- Use different combinations of **Graph Type** and **Graph Category** to gain deeper insights into Sales Lead activity and trends.
- This feature is useful for monitoring pipeline health, identifying bottlenecks, and supporting reporting.
[](https://hugeerp10.co.za/hsofmanual/uploads/images/gallery/2026-06/j7Fimage.png)
##### Graph Filters
The following fields are available to customise the graph display:
- **Graph Type**
Select the type of chart to display from the dropdown options (e.g. Bar, Line, Pie). This determines how the data is visually presented.
- **Graph Category**
Select the data grouping for the graph. For example, choosing *Lead Status* will display leads grouped by their current status (e.g. Pending, Closed).
- **Date From / Date To**
Define the date range for the data to be included in the graph. Only Sales Leads within this period will be displayed.
##### Graph Display
The graph is shown below the filter section and updates based on the selected criteria.
- In the example shown, a **Bar Graph** is used to display the **distribution of Sales Leads by Lead Status**.
- The vertical axis represents the **Number of Leads**, while the horizontal axis shows the selected category (e.g. *Pending*, *Total*).
- Each bar visually represents the volume of leads for that category, making it easy to compare performance at a glance.